Beyond the K-Shaped Narrative: A Deep Dive into Economic Reality and Psychological Impact

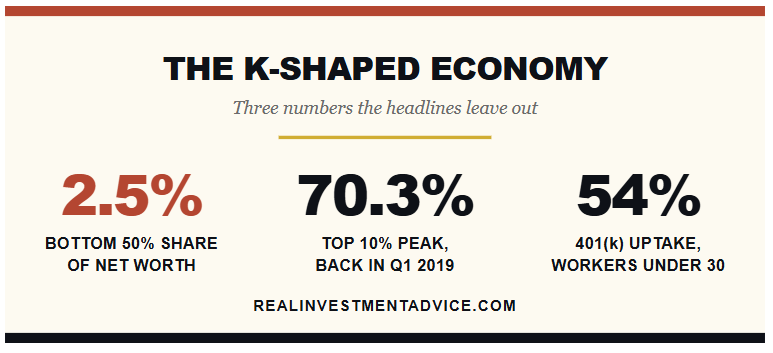
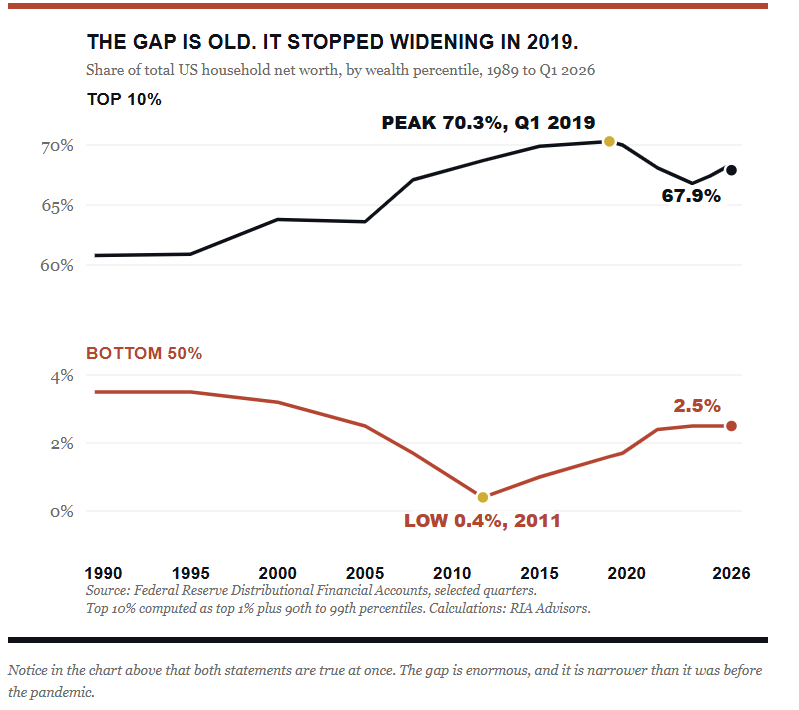
Economic discourse over the past several years has been overwhelmingly dominated by the concept of the "K-shaped economy"—a framework suggesting that recovery and growth systematically benefit high-earning households and asset owners while leaving lower-income demographics permanently behind. While this narrative captures certain visible economic pressures, particularly the compounding cost of living following pandemic-era inflation spikes, a comprehensive examination of federal data reveals a more nuanced reality. The bottom half of American households currently owns approximately 2.5% of the nation’s wealth—a figure that, while undeniably low, represents a significant improvement from the historical low of 0.4% recorded in 2011 and surpasses pre-pandemic levels.

Understanding the mechanics of the K-shaped economic framework requires separating genuine structural challenges from exaggerated media narratives. Economists, labor experts, and financial analysts increasingly point to a disconnect between macro-level financial data and public perception. While inflation has permanently altered the price level of consumer goods and services since 2019, wage dynamics, wealth accumulation patterns, and retirement preparedness among younger generations tell a story that directly challenges the prevailing doom-loop rhetoric.
Historical Context and Wage Dynamics
The divergence between the wealthy and the working class is not a novel economic phenomenon; structural stratification has existed across varying economic cycles throughout modern history. However, the post-pandemic era introduced anomalous labor market conditions. Between 2020 and 2023, an unprecedented wage compression occurred, driven by labor shortages and aggressive hiring practices at the lower end of the income distribution. Researchers David Autor, Arindrajit Dube, and Annie McGrew documented this phenomenon in their study, "The Unexpected Compression," noting that the 90/10 wage ratio temporarily reversed roughly a third of a forty-year divergence trend.
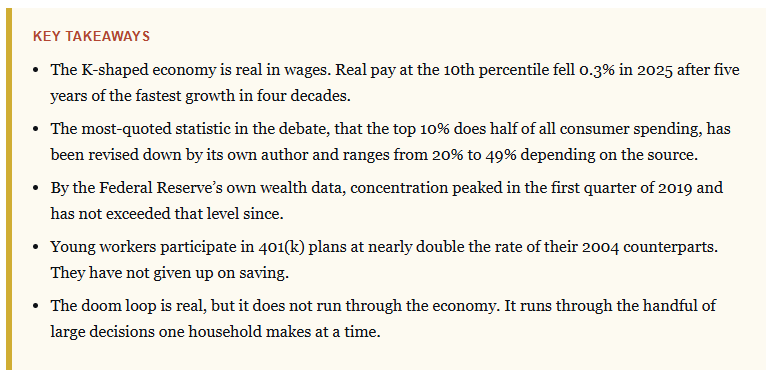
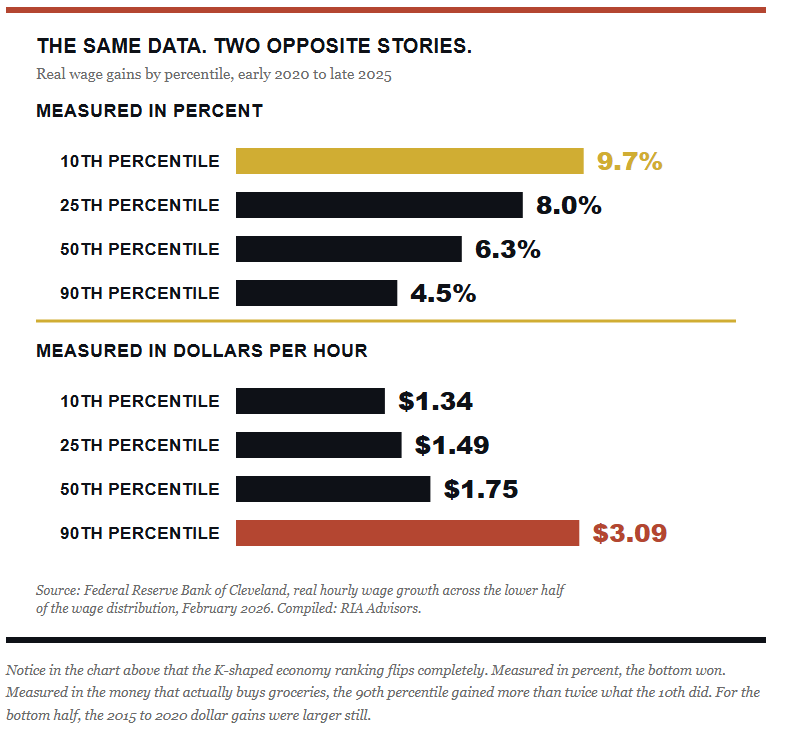
This momentum shifted as the post-pandemic recovery matured. Economic Policy Institute data from 2025 indicated that real wages for workers at the 10th percentile experienced a slight contraction of 0.3%, while median wages rose by 0.8%. Despite this recent plateau, broader data from institutions like the Cleveland Bank provide a longer horizon: between 2020 and late 2025, real wages at the 10th percentile grew by 9.7%, compared to 4.5% at the 90th percentile. In nominal dollar terms, however, this translates to $1.34 an hour for lower earners versus $3.09 an hour for top earners. Furthermore, absolute dollar gains for the bottom half were larger during the 2015–2020 window than during the celebrated pandemic-era surge, highlighting that low-wage growth is a multi-year trajectory rather than an isolated anomaly.
Inflation, Cost of Living, and Consumer Perception
The most persistent anchor of the K-shaped economy argument is the cumulative impact of inflation. Although the rate of inflation decelerated from its 2022 peak of approximately 9% to around 3.4%, this metric reflects a change in the rate of price increases rather than a reduction in price levels. Cumulative consumer price inflation since December 2019 sits at roughly 29%, establishing a permanent shift in the baseline cost of living.
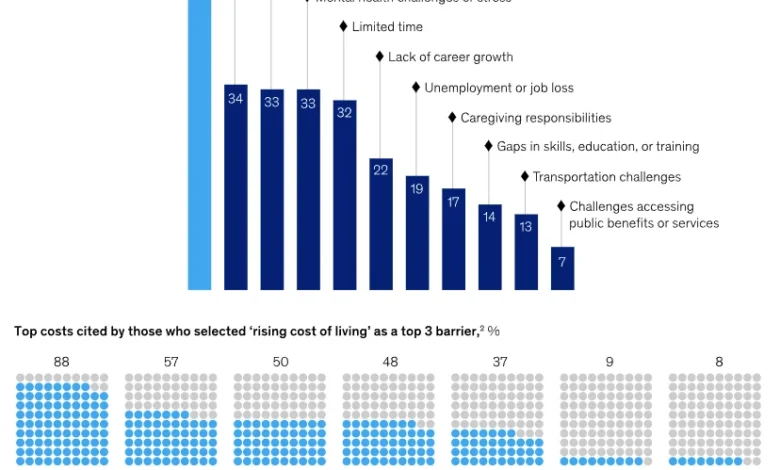
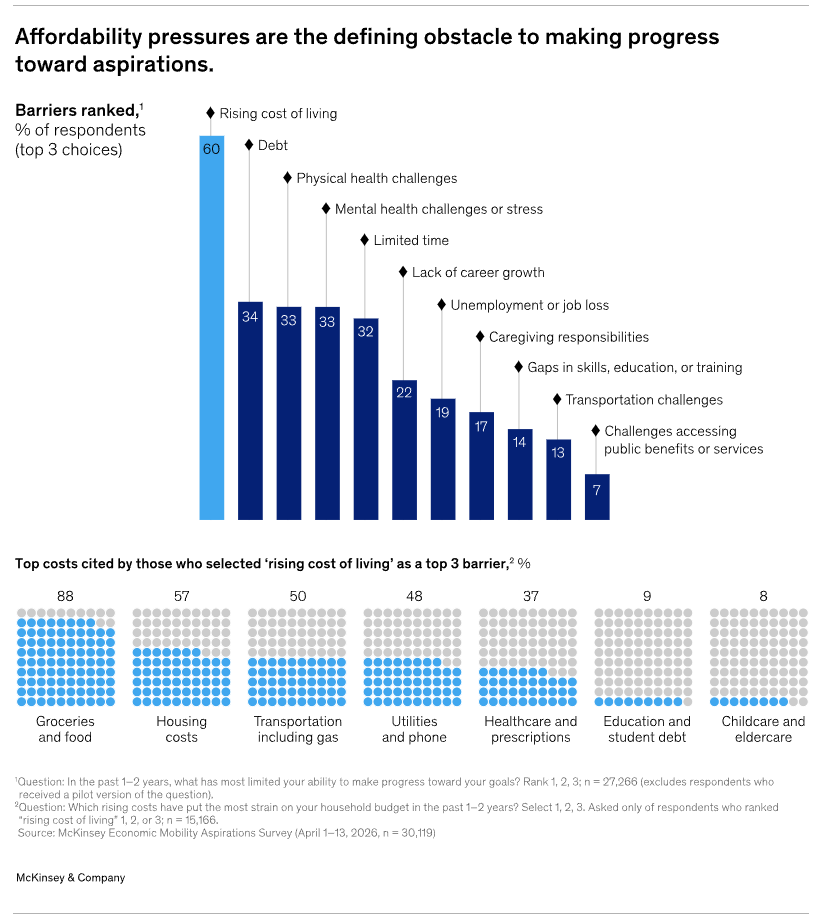
This permanent shift disproportionately impacts households lacking liquid assets or significant investment portfolios. A comprehensive study published by McKinsey & Company in April, surveying over 30,000 Americans, revealed that 60% of respondents identified the cost of living as one of their top three financial barriers, a sentiment that spanned across income brackets, including households earning upwards of $150,000 annually.
Compounding these structural cost pressures are policy shifts and labor market adjustments. By early 2026, the national hiring rate dipped to 3.1%—a level not seen outside of recessionary periods—while long-term unemployment, measured as those unemployed for 27 weeks or more, climbed to 27.5% by May. Additionally, the expiration of enhanced Affordable Care Organization (ACA) tax credits triggered significant adjustments in healthcare expenses, pushing average net marketplace premiums up by 58% and average deductibles up by 37% within a single year. These metrics substantiate the genuine financial friction experienced by households at the lower end of the economic spectrum.
Deconstructing Exaggerated Metrics and Wealth Concentration
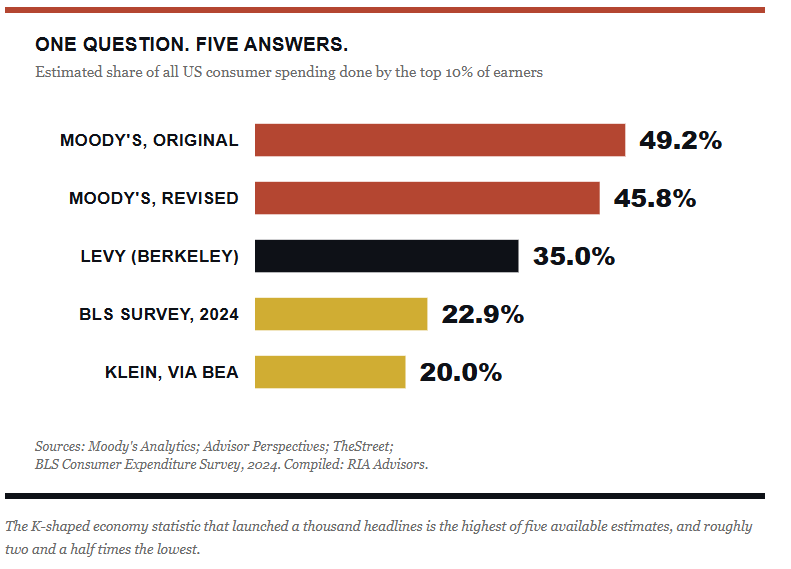
Public discourse regarding the K-shaped economy frequently relies on statistical claims that lack consistent empirical backing. The most prominent example is the oft-repeated assertion that the top 10% of income earners account for approximately 50% of all consumer spending. Originating from Moody’s Analytics, this figure has faced downward revisions—dropping to 45.8% following methodological updates.
Independent researchers, including Antoine Levy from the University of California, Berkeley, have highlighted the fundamental arithmetic discrepancies in such claims. Given that the top decile captures between 35% and 40% of total disposable income and maintains a high savings rate, allocating half of all consumer spending to this group defies macroeconomic balancing equations. The Bureau of Labor Statistics (BLS) Consumer Expenditure Survey places the actual spending share of the top decile closer to 22.9%. The variability across these estimates demonstrates how speculative narratives often outpace verifiable data.
The wealth distribution data compiled by the Federal Reserve through its Distributional Financial Accounts further contradicts popular assumptions about unbridled wealth concentration. The share of household net worth held by the top 10% peaked at 70.3% in the first quarter of 2019 and moderated to 67.9%. Conversely, the wealth share of the bottom 50% rose from a cyclical low of 0.4% in late 2011 to 1.7% in 2019, reaching 2.5%.
Crucially, the net worth gains captured by the bottom half over recent years were largely counterbalanced by losses in the 90th to 99th percentiles—the professional managerial class—rather than the ultra-wealthy. Historical comparisons underscore that past economic recoveries were significantly more regressive; during the post-2008 recovery spanning 2009 to 2012, the top 1% captured 91% of real income growth without generating equivalent media scrutiny regarding structural societal divides.
Psychological Implications and Behavioral Shifts
Perhaps the most damaging manifestation of the K-shaped economy narrative is its psychological impact on younger demographics, particularly Gen Z and younger millennials. Despite widespread media characterizations of youth as financially hopeless or "nihilistic," empirical data from administrative records paint a surprisingly contrasting picture.
Vanguard’s retirement data indicates that 401(k) participation rates among young workers stand at 54%, compared to just 28% for the same age cohort in 2004. Savings rates and average balances have experienced parallel increases. Vanguard’s long-term projection models suggest that 47% of Gen Z workers are currently on track to sustain their pre-retirement standard of living—surpassing the retirement readiness metrics of the Baby Boomer generation at equivalent ages. McKinsey surveys further corroborate that despite confronting difficult entry-level labor markets and heightened mental health challenges, adults aged 18 to 24 express higher levels of optimism regarding their future financial momentum than older cohorts.

However, behavioral economists note that pervasive media narratives can drive counterproductive financial actions at the margin. Research from Northwestern University examining transactional data across 230,000 households found a strong correlation between widespread economic pessimism, the expansion of legal sports betting, and a corresponding reduction in traditional household savings and investment vehicles. New York Fed researchers identified rising credit card delinquency rates among younger demographics in states with legalized mobile gambling, while academic estimates link thousands of annual personal bankruptcies directly to speculative online wagering.
Parallel trends are visible in retail financial markets, where zero-day-to-expiration (0DTE) options contracts accounted for 65% of total S&P 500 index options volume. Platform data from market makers like Citadel Securities indicates that nearly half of all retail options volume expires on the same trading day. Financial advisors emphasize that these speculative behaviors, rather than structural economic exclusion, often explain the ongoing performance gap between retail traders and broader equity indices.
Strategic Recommendations and Long-Term Outlook
Navigating modern economic headwinds requires separating systemic fiscal reality from sensationalized media frameworks. Financial literacy experts advocate for four core principles to ensure long-term stability:
- Calibrate Benchmarks: Financial health should be measured against personal long-term plans and individualized savings milestones rather than societal outliers or curated digital media personas.
- Prioritize Structural Investment over Speculation: Long-term wealth creation relies on consistent capital allocation in traditional equities and retirement vehicles rather than high-risk speculative trading or gambling.
- Automate Financial Discipline: Utilizing structural mechanisms such as auto-enrollment in employer-sponsored retirement plans significantly increases participation and savings consistency by removing reliance on daily willpower.
- Evaluate Affordability Realistically: While housing affordability metrics highlight historical challenges regarding price-to-income ratios and down payment accumulation, focusing on fundamental budget management and realistic debt-to-income limits remains the most effective pathway to asset ownership.
Ultimately, the K-shaped economy is a recognized structural reality compounded by cyclical inflation, but it is not an insurmountable destiny. By prioritizing empirical data over widespread perception, individuals can execute actionable strategies that foster long-term financial resilience.
Related posts: