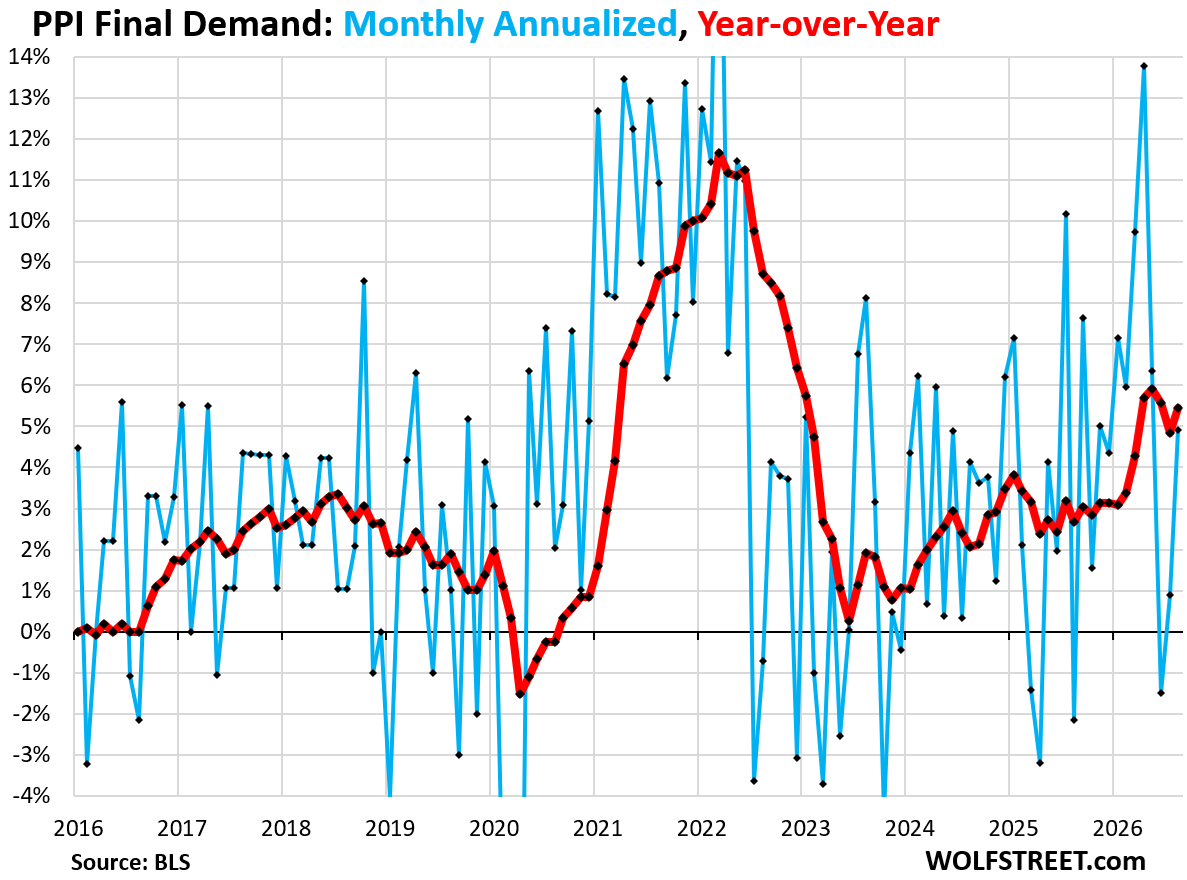
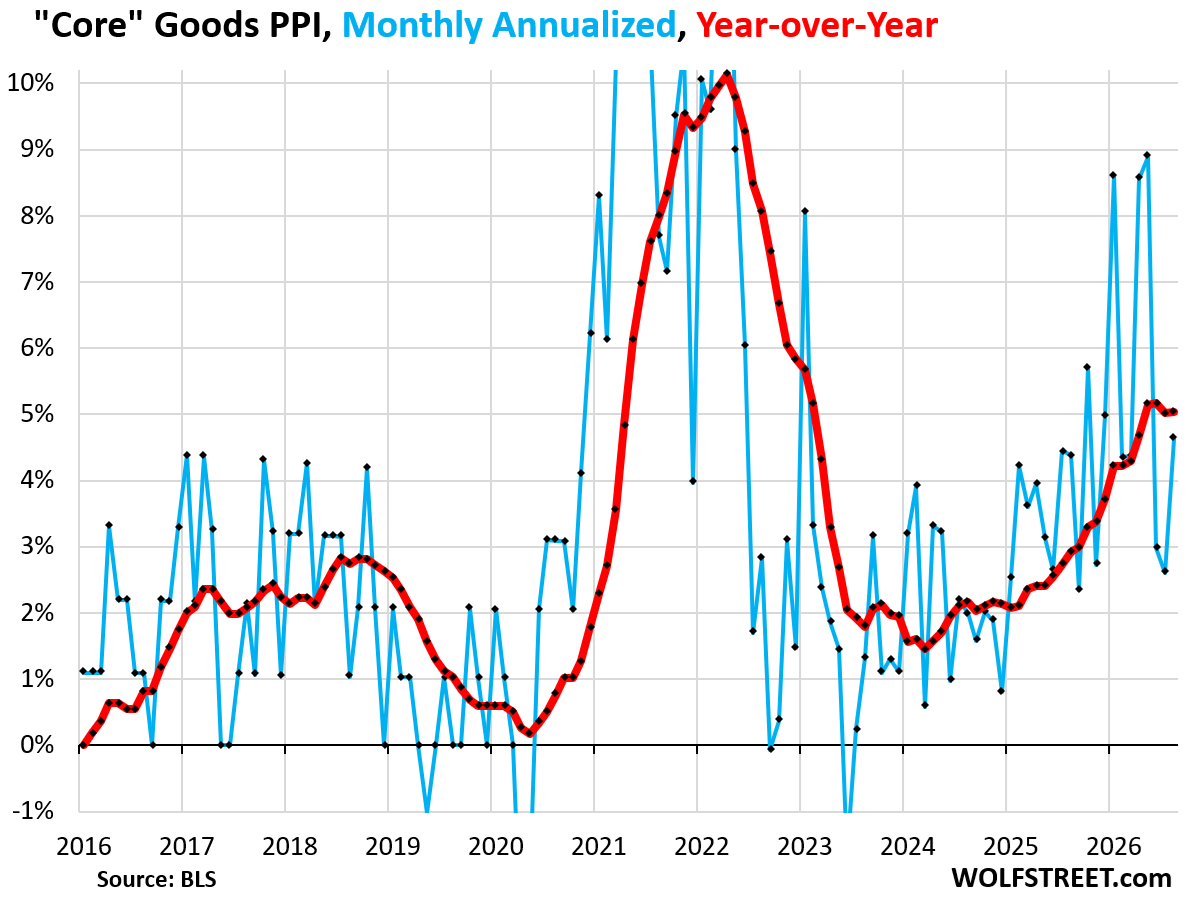
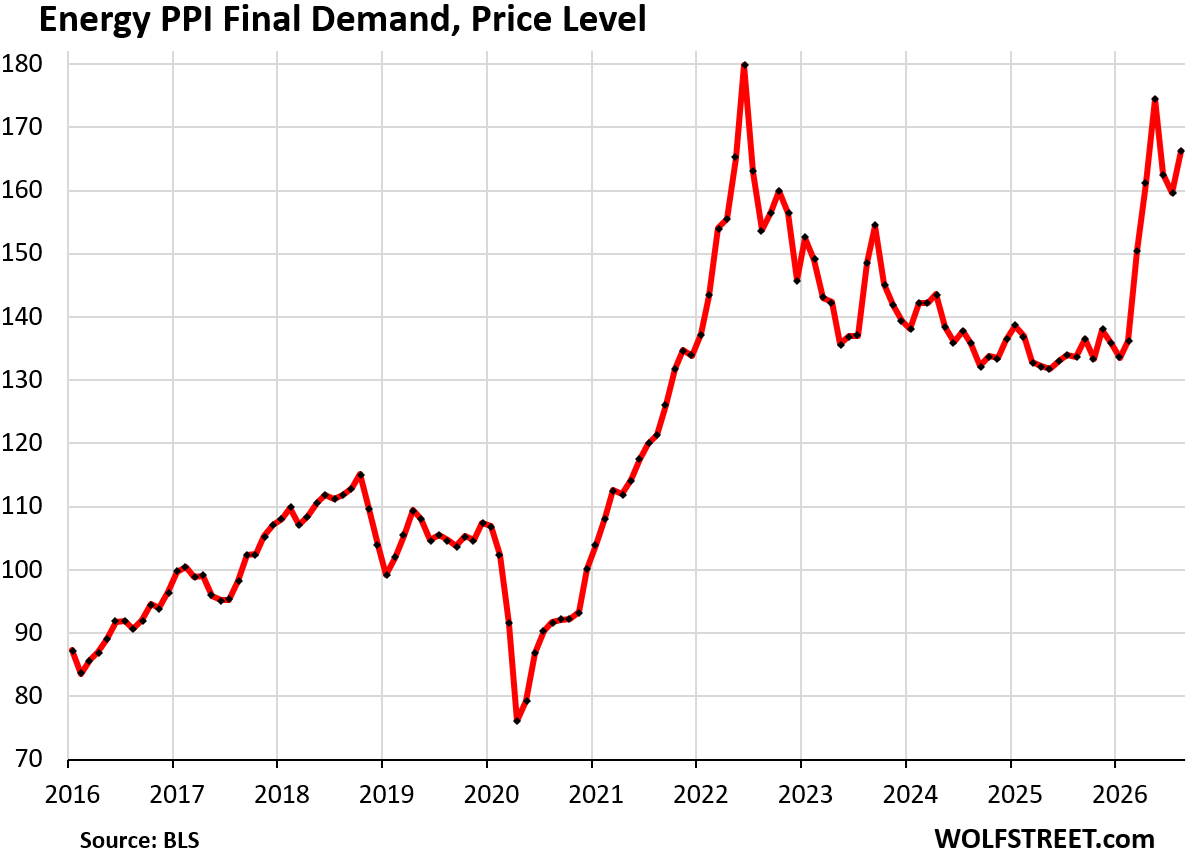
This kind of inflation is nothing to be trifled with: In services +4.5%; in goods without energy +5.0%; in energy +24%; overall +5.4%; year-over-year.

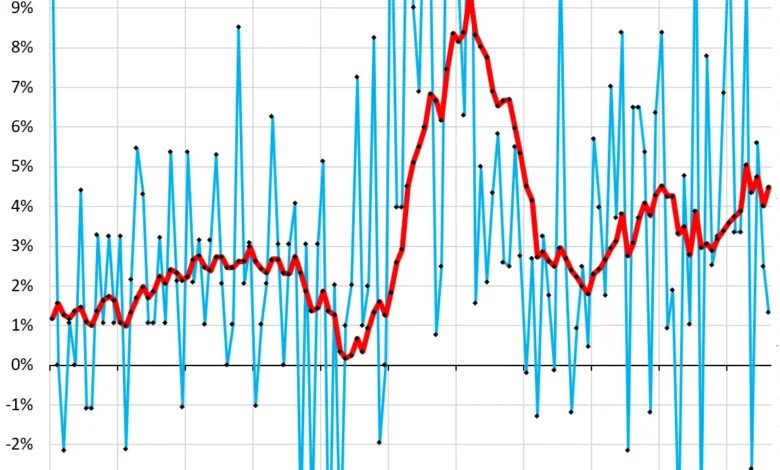
The latest Producer Price Index (PPI) data released by the Bureau of Labor Statistics (BLS) paints a sobering picture of the inflationary pressures currently embedded within the industrial supply chain. As companies continue to pass costs along to one another, the broad-based acceleration in price indices suggests that inflationary momentum is far from extinguished. The headline PPI for Final Demand climbed 5.4% year-over-year in August, underpinned by a monthly increase of 0.40%, or 5.0% on an annualized basis. These figures, which were bolstered by upward revisions to July data, confirm that the cost of doing business is rising at a rate that necessitates a rigorous reevaluation of current monetary policy.
A Deconstruction of Supply-Side Inflation
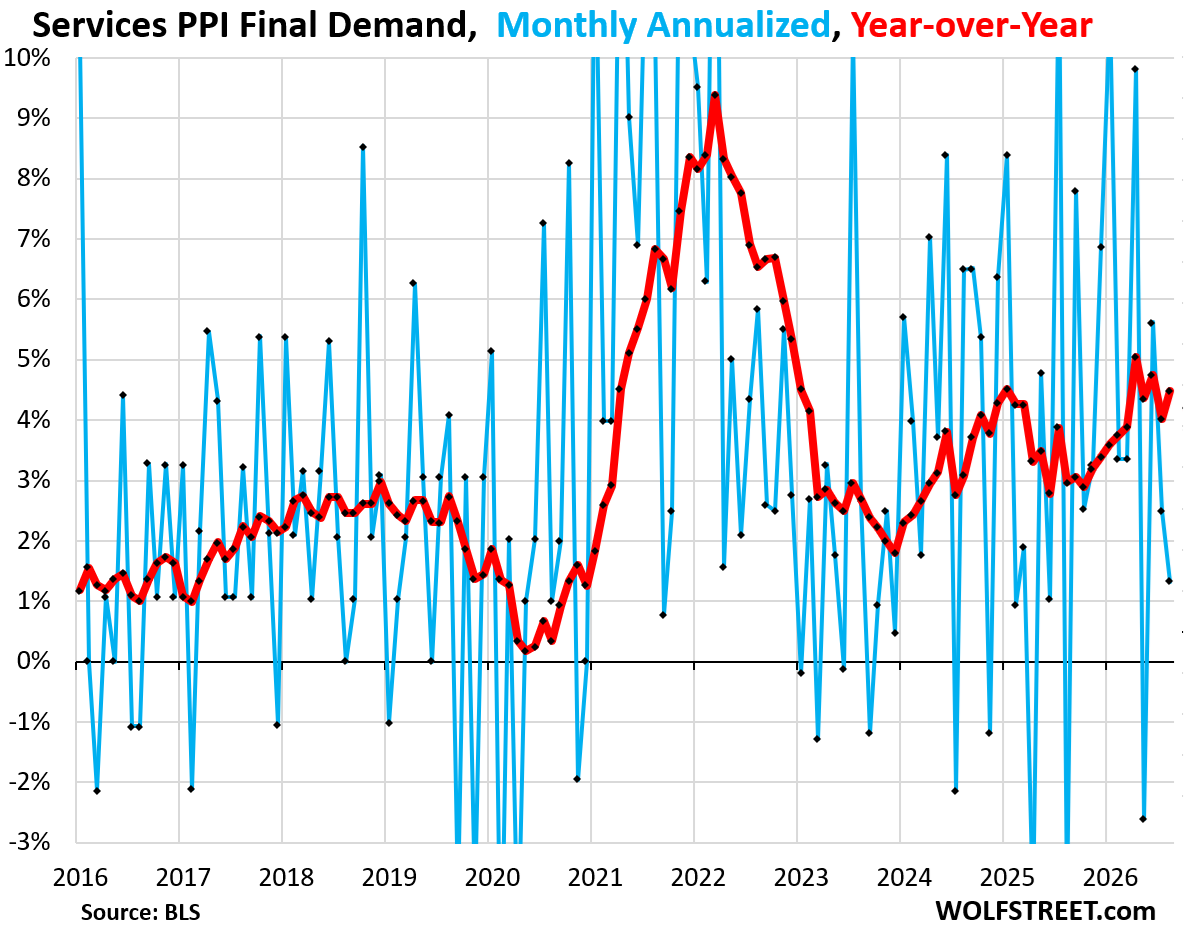
The structural integrity of the PPI data reveals that inflation is not merely a product of volatile energy markets, but a systemic issue woven into the fabric of the services and manufacturing sectors. The services sector, which constitutes approximately 68% of the total PPI Final Demand, saw a year-over-year price increase of 4.5%. While the month-to-month growth for services was a more modest 0.11%, the cumulative effect of these incremental gains is significant.
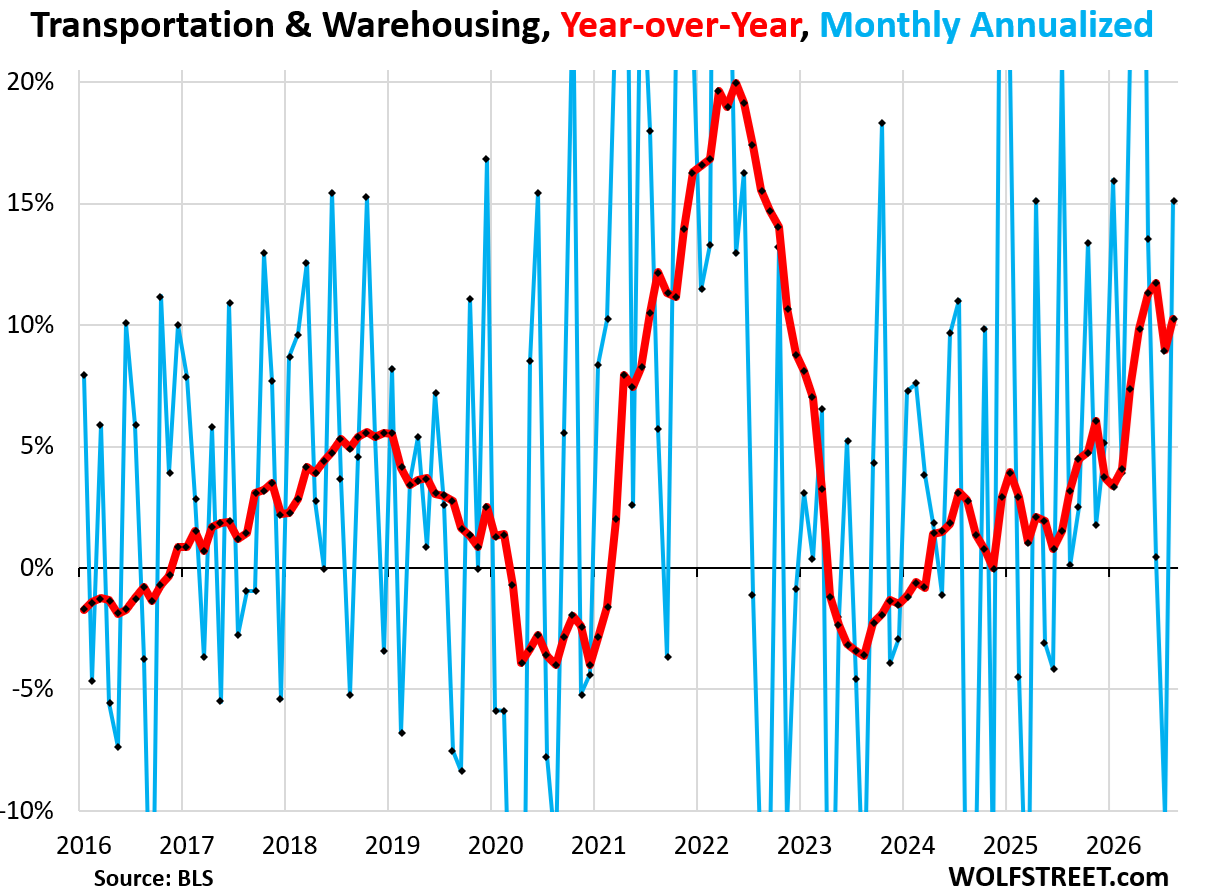
Within this services basket, the transportation and warehousing sector emerged as a particular point of concern. Prices in this sub-sector spiked by 10.3% year-over-year, with a monthly surge of 1.2%—translating to a staggering 15.1% annualized rate. This escalation is largely attributed to the compounding effect of higher fuel costs and labor-related overheads, both of which are proving difficult to contain.
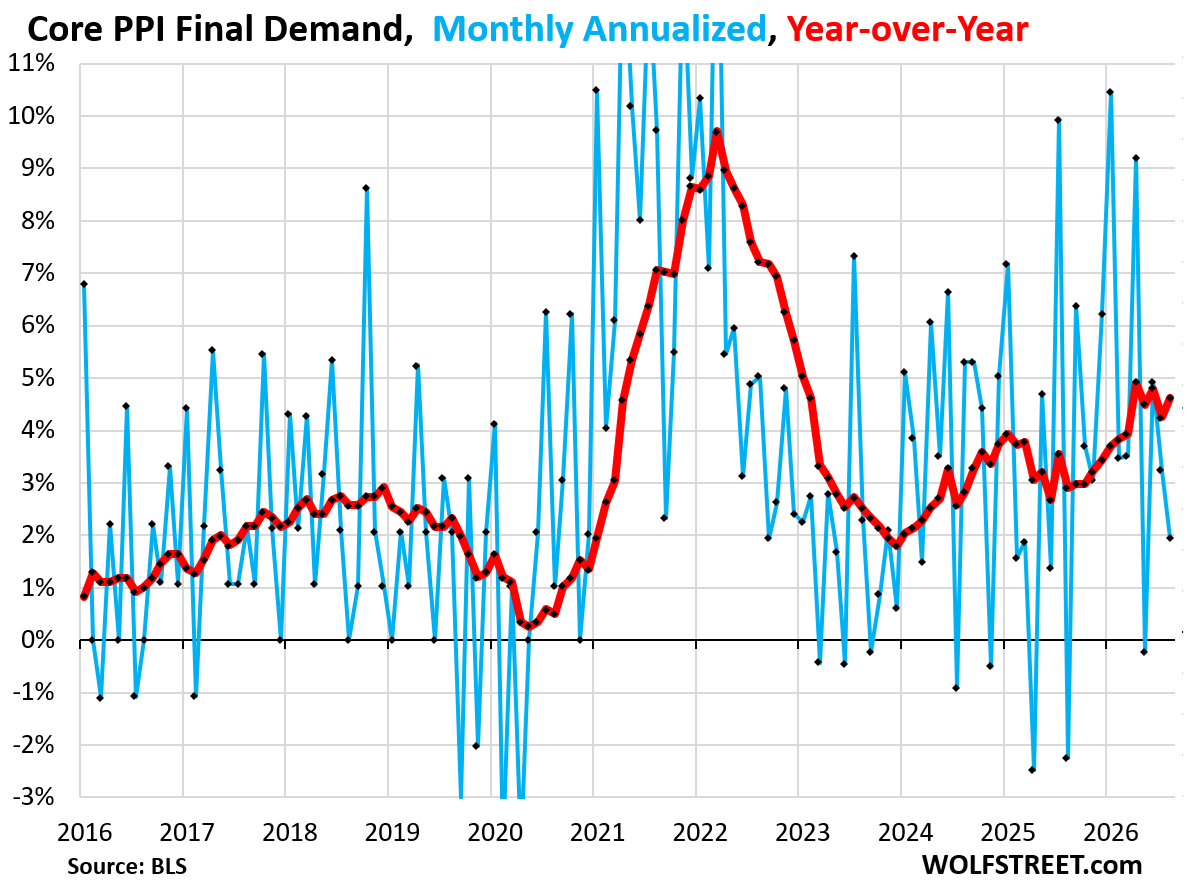
Conversely, the core PPI—which strips out the volatility of food and energy—posted a 4.6% year-over-year increase. The core goods sector, specifically, has remained in a high-inflation range for four consecutive months, hitting levels not seen since early 2023. This sustained growth in core goods, which rose 5.0% year-over-year, suggests that the "sticky" nature of inflation is migrating from raw commodity costs into finished manufactured products.
Chronology of the Current Inflationary Cycle
To understand the current trajectory, one must examine the timeline of the post-2023 recovery. Following the cooling observed in mid-2023, industrial price indices began a period of erratic, "zigzagging" growth. By January 2024, the core PPI index began a consistent upward trend that has accelerated throughout the summer of 2026.
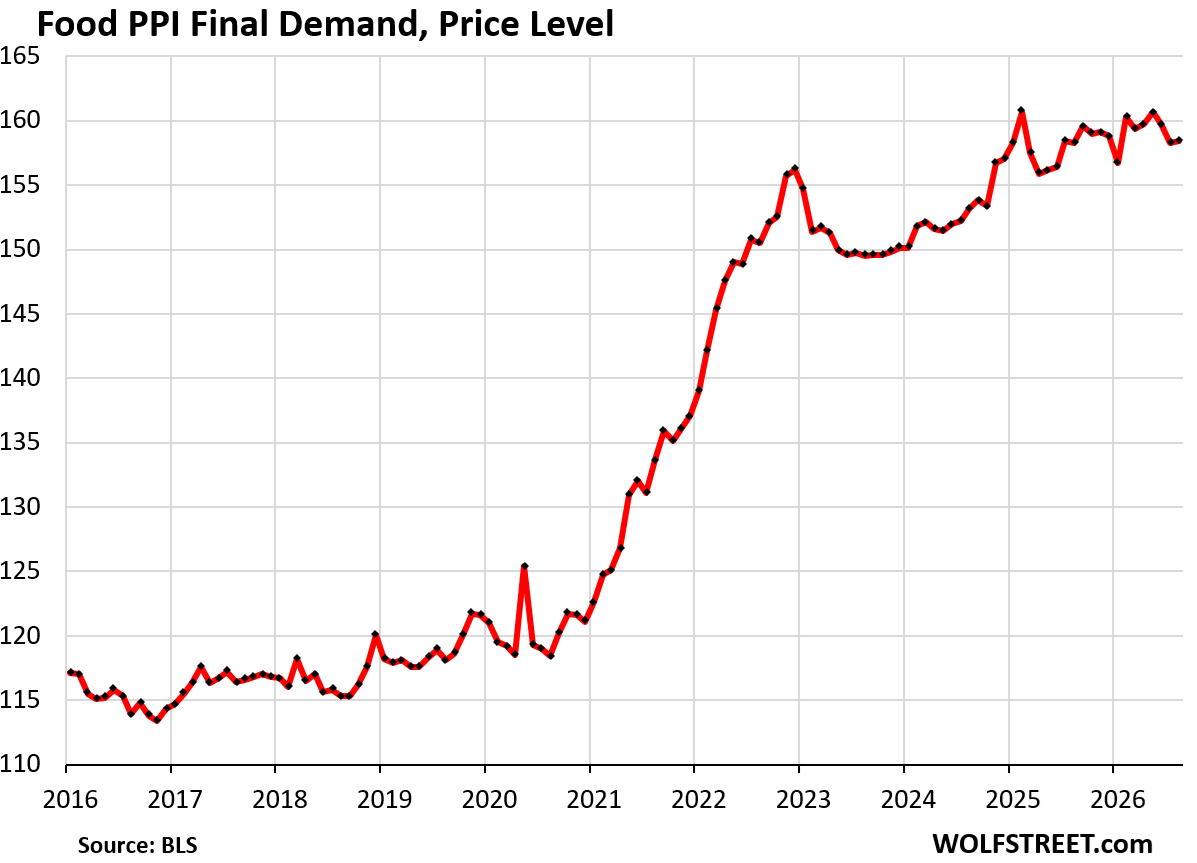
The energy sector has provided the most dramatic volatility in this chronology. After a period of relative stabilization, energy prices spiked 24.3% year-over-year in August. This jump, representing a 4.16% month-to-month increase (or 63% annualized), serves as a reminder of the vulnerability of global supply chains to energy market disruptions. In contrast, the food sector has demonstrated a different profile. Following a 36% cumulative surge between mid-2020 and February 2025, food prices at the producer level have entered a period of relative stagnation. While some commodities, such as eggs, saw sharp declines after previous peaks, other agricultural inputs have continued to rise, effectively neutralizing any deflationary relief.
Broader Economic Implications and GDP Data
The impact of these producer-level price hikes is not confined to corporate balance sheets. Economic data released in conjunction with the latest PPI figures underscores a broader, more systemic inflationary environment. Data from the most recent quarter shows that the inflation rate for the overall economy—a metric that encompasses consumers, businesses, government entities, and non-profits—surged by 6.4% on an annualized basis.
This quarterly figure, which was also subject to upward revisions, indicates that the inflationary impulse is moving through the economy with greater velocity than previously estimated. When the overall economy experiences inflation of 4.4% year-over-year alongside a 5.4% PPI reading, the disconnect between price stability and the current fiscal reality becomes stark. For the Federal Open Market Committee (FOMC), these metrics present an increasingly narrow path for policy maneuvers. The expectation that inflation would simply "wait out" the current cycle appears increasingly detached from the data.
Market Analysis and Monetary Policy Outlook
The persistent rise in the PPI suggests that producers are maintaining pricing power despite high interest rates. When businesses can successfully pass on a 5.0% increase in core goods costs and a 4.5% increase in service costs to their customers, it suggests that demand remains resilient or that supply constraints are preventing market equilibrium.
Economists observing these trends note that the transition from producer-facing inflation to consumer-facing inflation—as measured by the Consumer Price Index (CPI) and the Personal Consumption Expenditures (PCE) price index—is the next phase of the cycle. While consumer-facing metrics have historically shown lower volatility than the PPI, the gap between the two is closing.
The pressure on the FOMC to act is mounting. With the current chair and the board of governors under scrutiny, there is growing consensus among market analysts that the era of "dilly-dallying" must come to an end. The current data implies that the neutral rate of interest may be higher than policymakers previously assumed. If the central bank continues to maintain a wait-and-see approach while producer prices continue their upward trajectory, they risk allowing inflation expectations to become de-anchored.
The Path Forward
As the Federal Reserve approaches its next policy meeting, the primary challenge will be balancing the necessity of cooling the economy without precipitating an unnecessary contraction. However, the data suggests that the "soft landing" narrative is under significant duress. The structural nature of the current inflation, particularly in services and transportation, implies that it is not merely a temporary supply-chain hiccup but a function of sustained input cost inflation.
The implications for the remainder of 2026 are clear: businesses will continue to face margin compression unless they can continue to pass costs to the end consumer. If consumer spending remains robust, as evidenced by recent data on retail and automotive expenditures, the inflationary loop will likely continue. Conversely, if high producer prices eventually erode consumer purchasing power, the economy may face a period of stagflationary pressure, where prices remain elevated while output growth stalls.
In summary, the August PPI report serves as a critical indicator of a resilient inflationary environment. The acceleration across key sectors—energy, core goods, and essential services—signals that the economy is absorbing significant price shocks. For policymakers and investors alike, the data is a clear mandate: the inflationary environment is deep, broad, and requires a decisive, data-driven response to ensure long-term stability. The window for gradual adjustments may be closing, leaving the FOMC with few options other than a more aggressive stance to bring inflation back within target ranges.
Related posts: