The landscape of American household finance underwent a notable shift in the third quarter of 2026, as total outstanding household debt reached a historic peak of $19.1 trillion. According to the latest Household Debt and Credit Report, compiled by the Federal Reserve Bank of New York in collaboration with Equifax, this figure represents a $334 billion increase from the second quarter, marking a 1.8% rise. After two consecutive quarters of relative stagnation, the uptick reflects a return to growth, though the underlying drivers of this debt expansion are nuanced, involving a mix of technical reporting adjustments and broader macroeconomic trends.
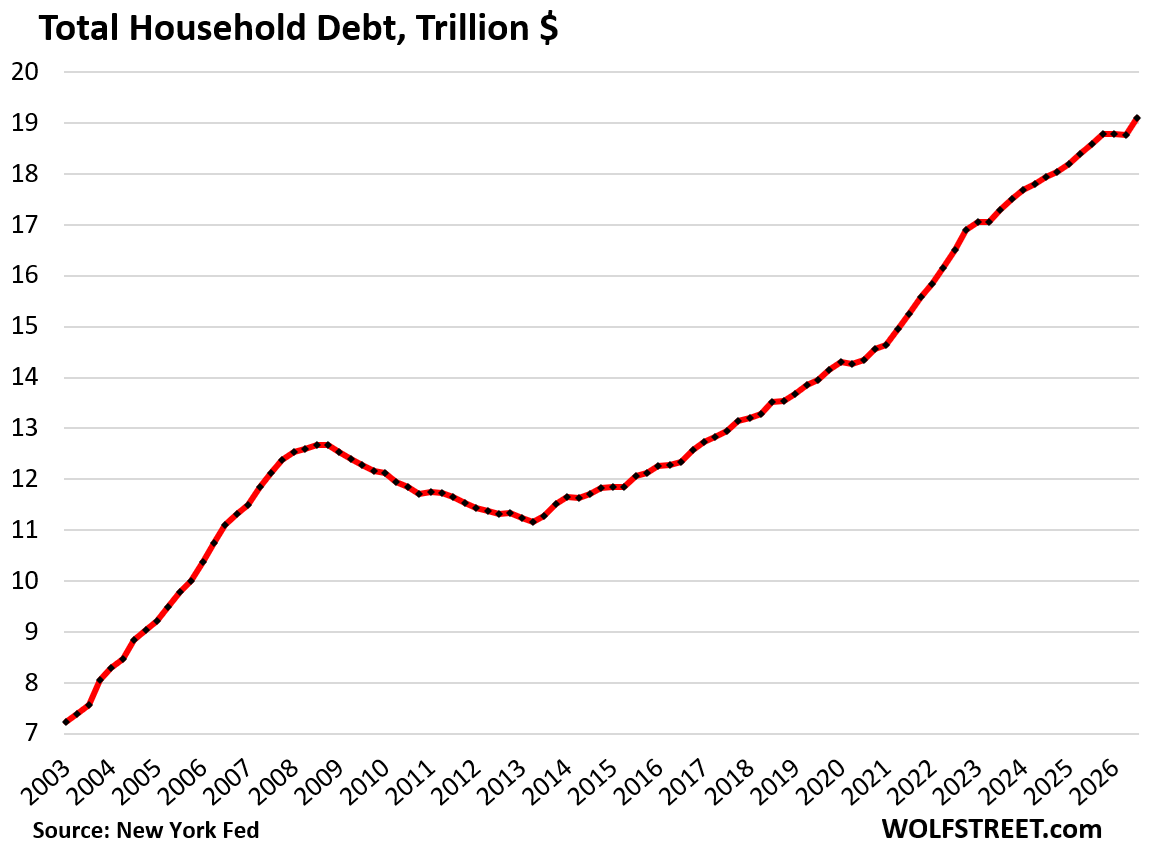
The increase in total household debt—which encompasses mortgages, home equity lines of credit (HELOCs), student loans, auto loans, credit card balances, and various forms of consumer credit like Buy Now, Pay Later (BNPL) arrangements—is largely attributable to a technical rebound in mortgage reporting. During the second quarter, a temporary discrepancy in the transfer of mortgage servicing led to an under-reporting of balances. With that data successfully integrated into the third-quarter figures, mortgage debt surged by $257 billion, accounting for the lion’s share of the quarterly growth. When viewed on a year-over-year basis, the $520 billion increase represents a 2.8% rise, which, while significant, stands as the second-smallest growth rate since the second quarter of 2021, suggesting a degree of moderation in credit expansion compared to the post-pandemic surge.
Historical Context and Debt Burden Metrics
To understand the current state of American household leverage, economists frequently look toward the debt-to-disposable-income ratio. This metric serves as a barometer for financial health, comparing the weight of obligations against the income available to meet them. By the end of the third quarter, this ratio ticked up to 78.9%. While this is an increase, it remains historically low when measured against data dating back to 2003, with the notable exception of the "stimulus era" during the pandemic, when government intervention artificially inflated disposable income levels.
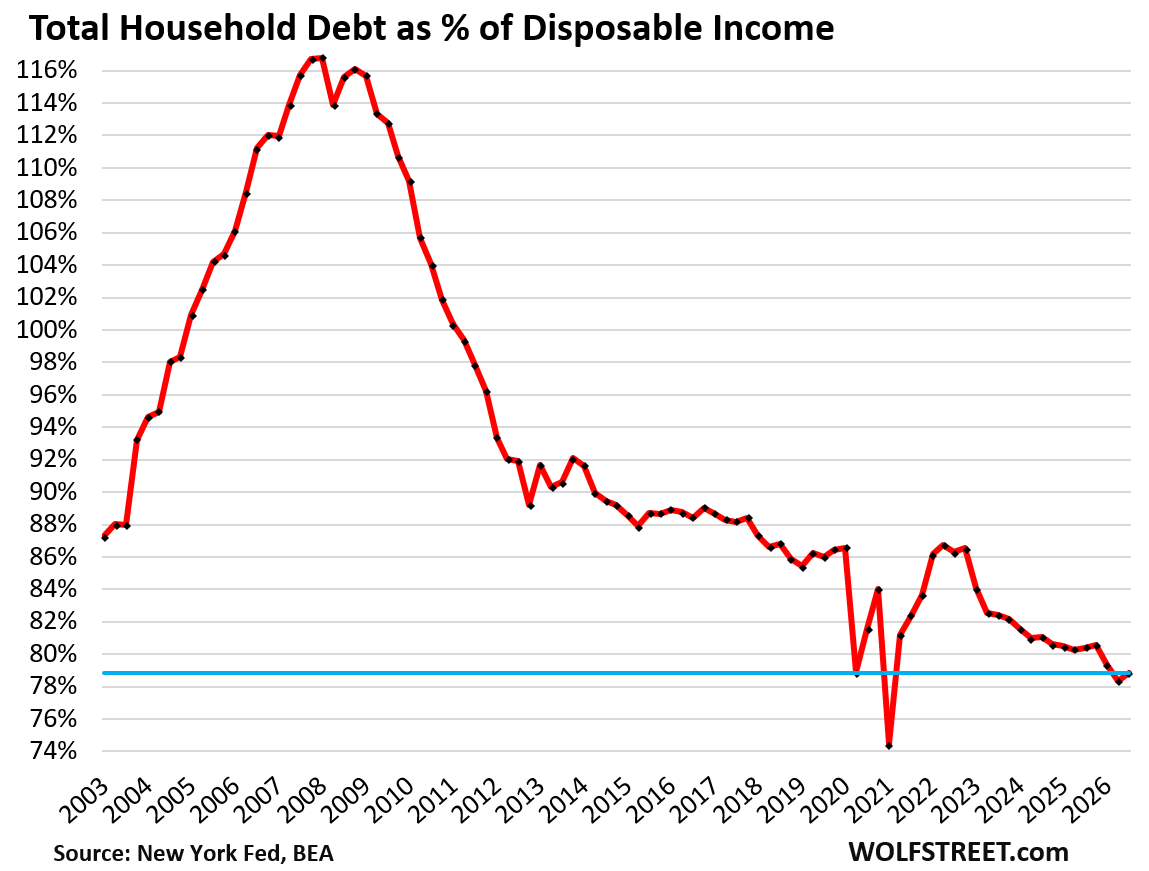
The contrast between the current financial climate and the period leading up to the 2008 Financial Crisis is stark. During the mid-2000s, the debt-to-disposable-income ratio climbed past the 100% threshold, signaling a period of extreme overleverage among consumers and excessive risk-taking by financial institutions. Today’s households operate under a different set of conditions. Roughly 65% of American households own their homes, and many have benefited from the significant appreciation of residential real estate values that occurred through mid-2022. Consequently, a substantial portion of homeowners holds significant home equity, with nearly 40% of residential properties owned free and clear.
Beyond real estate, the diversification of household assets—ranging from equities and precious metals to cryptocurrencies and more than $5 trillion currently parked in money market funds and certificates of deposit (CDs)—suggests that the primary risks to the economy have shifted. Observers note that while the household sector appears resilient, potential vulnerabilities have migrated toward overleveraged corporate entities, particularly those heavily invested in the nascent artificial intelligence sector, and the federal government, which continues to manage a record-setting debt load.

Chronology of Delinquency and Policy Shifts
The delinquency data for 2026 presents a complex picture, heavily influenced by the conclusion of federal student loan forbearance policies. Since 2020, pandemic-era relief measures effectively shielded student loan borrowers from mandatory payments, keeping delinquency rates for this specific asset class at near-zero levels. As those forbearance protections expired in 2025, borrowers who failed to resume payments saw their loans re-classified as delinquent on credit reports. This transition caused serious delinquency rates for student loans to surge back above the 10% threshold—a return to pre-pandemic norms.
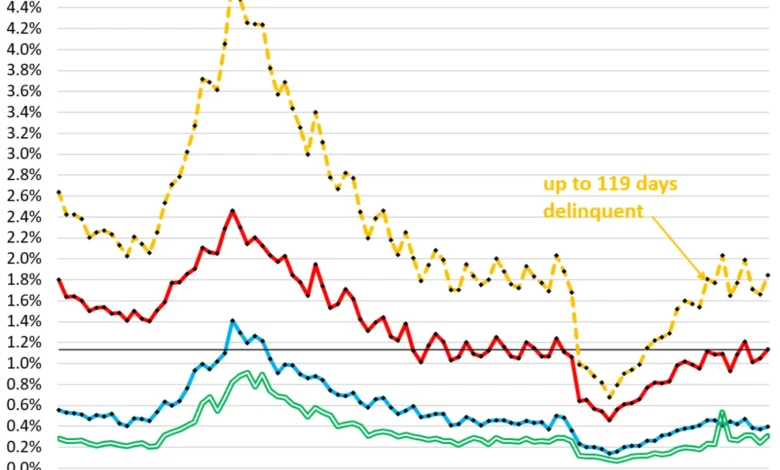
This specific phenomenon has exerted upward pressure on the aggregate delinquency rate for all household debts. Currently, the combined delinquency rate for major debt categories stands at 1.8%. While this marks an increase from the near-zero rates recorded during the height of the forbearance era, it remains largely consistent with, or even below, the delinquency levels observed in the three years immediately preceding the pandemic.
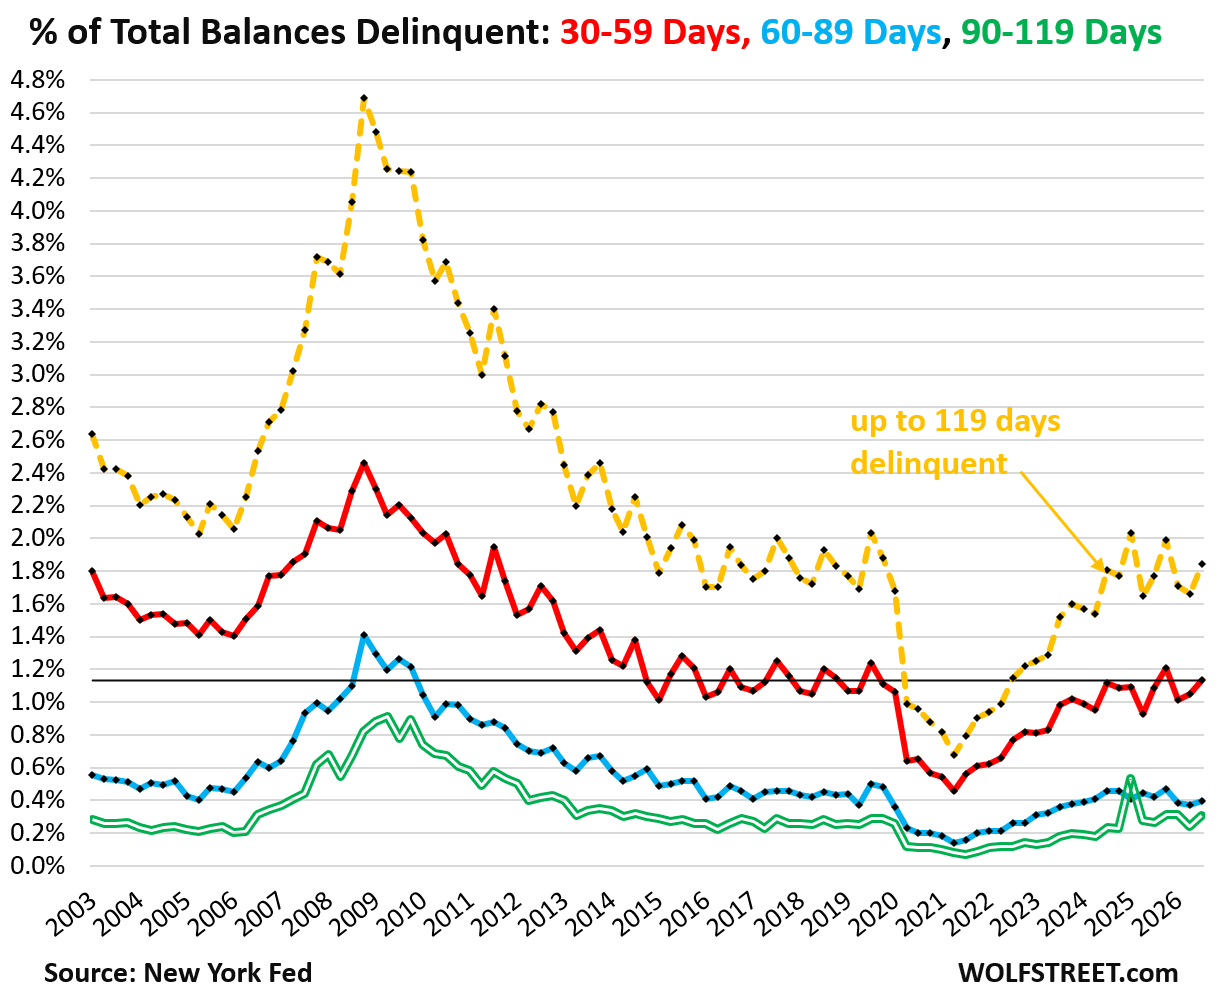
Furthermore, analysts distinguish between "flow" and "stock" delinquencies. The New York Fed has clarified that the rising stock of delinquent debt, particularly in credit card accounts, is partly a result of "stale" or charged-off accounts that remain on credit reports for extended periods. This indicates that the rise is more a reflection of accounting and reporting protocols than a fundamental deterioration in the creditworthiness of the average consumer.
Foreclosures and Consumer Distress Indicators
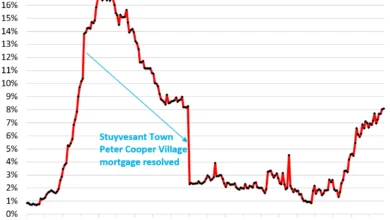
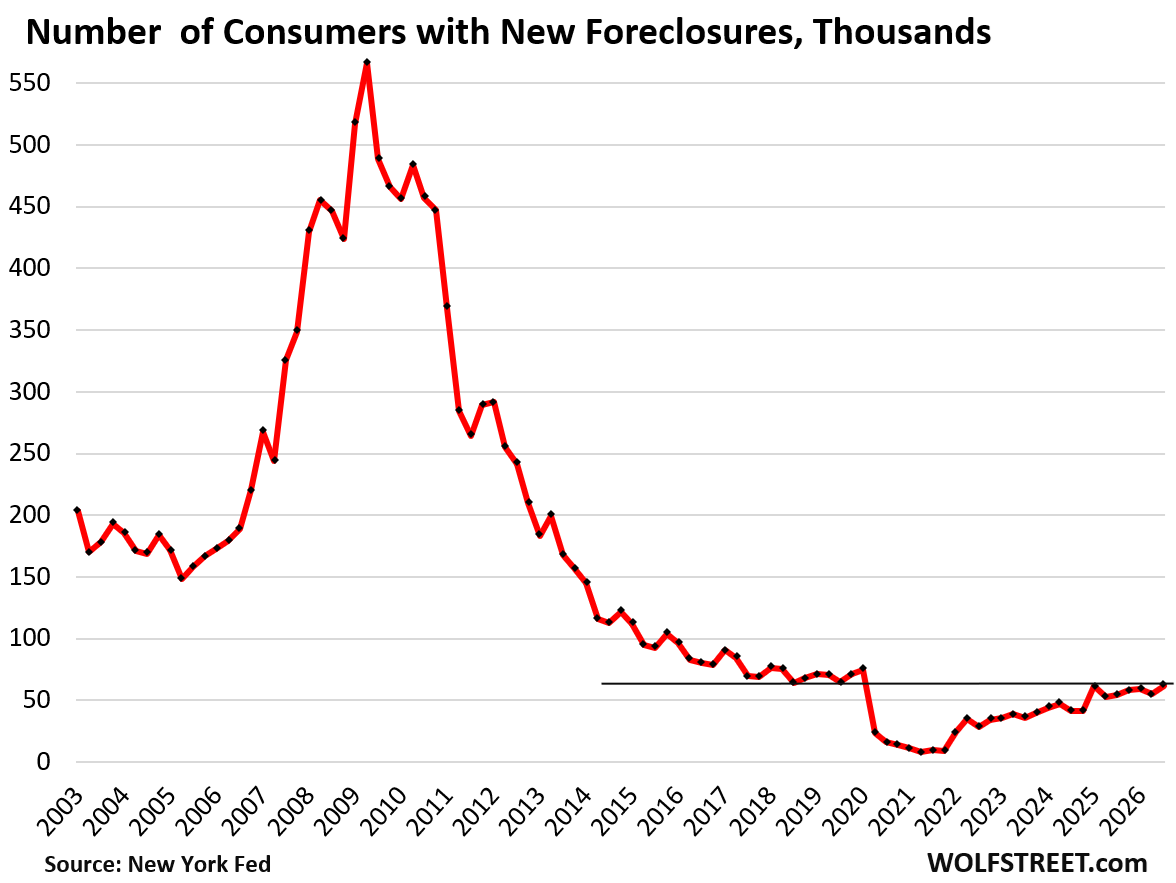
The housing market, despite recent turbulence, has not yet reflected a systemic rise in mortgage defaults. New foreclosures in the third quarter reached 61,900, a level that remains historically low and is at the bottom end of pre-pandemic trends. While recent data suggests that the condominium market is facing significant headwinds—including a sharp decline in sales and an influx of supply—this has not translated into a widespread "walking away" from mortgages.
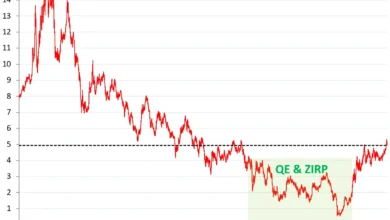
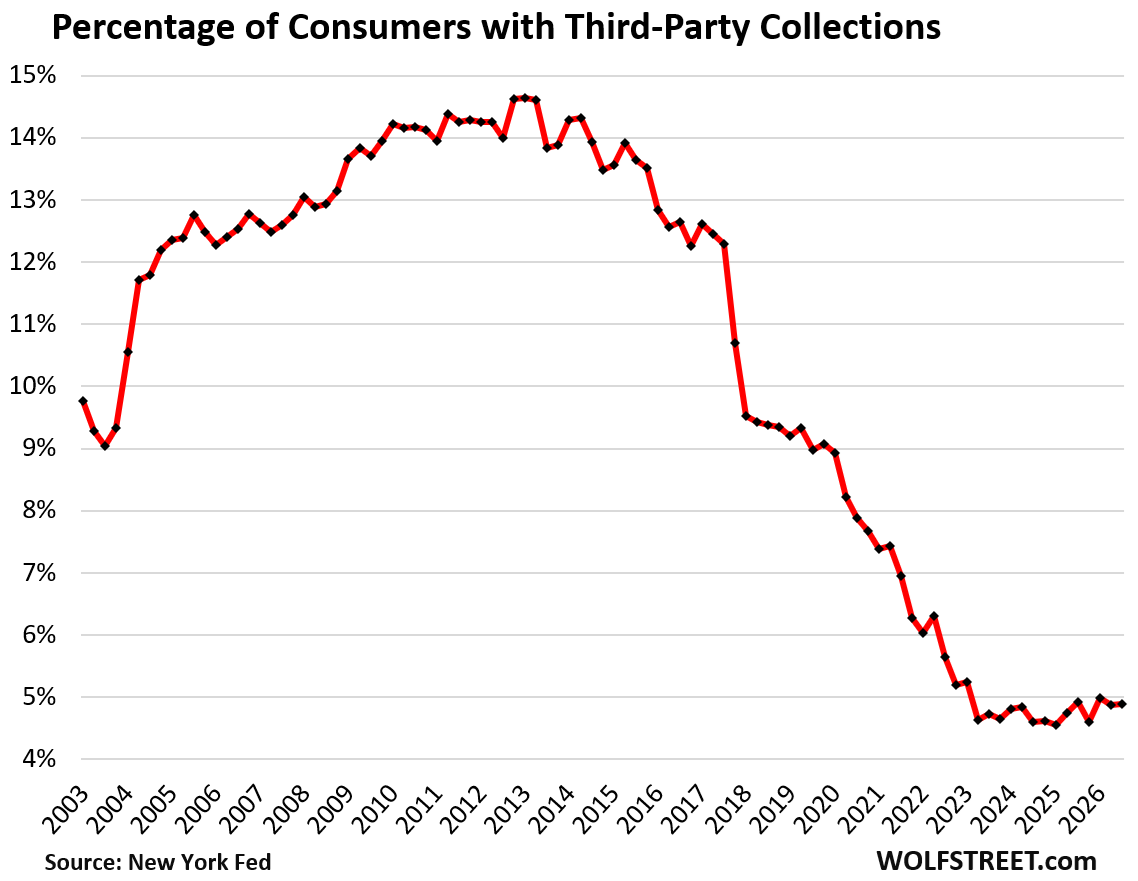
Similarly, other indicators of financial distress remain subdued. The share of consumers with third-party collections on their credit records in the last 12 months is holding steady at 4.9%. This is a significant improvement from the 2008–2015 period, during which the aftermath of the Great Recession and the housing collapse pushed this figure above 14%. New bankruptcy filings also remain at near-record lows, with 135,220 filings in the third quarter, a figure that continues to defy the expectations of those who anticipated a wave of defaults as interest rates and living costs rose.
Implications for the Broader Economy
The data suggests that the American consumer remains in a relatively stable position, buoyed by high levels of asset ownership and conservative leverage ratios. However, the reliance on technical adjustments to understand current debt levels highlights the importance of context. The primary takeaway from the third-quarter report is that the "debt burden" is not currently driven by a lack of capacity, but rather by the normalization of credit reporting after years of government-mandated forbearance and pandemic-era distortions.
Financial analysts from the Federal Reserve and independent institutions generally emphasize that while individual segments, such as student loan borrowers or condo owners, may be feeling the pressure of a changing interest rate environment, the broader household balance sheet is not showing signs of a crisis. Instead, the focus for policymakers and investors has moved toward the long-term sustainability of government fiscal policy and the health of corporate balance sheets, which face a different set of risks than the average American household. As the nation moves into the final quarter of the year, the stability of consumer credit will remain a critical, if often misunderstood, indicator of the country’s economic trajectory. Future reports are expected to drill deeper into the specific mechanics of housing, auto, and revolving credit debt to provide a more granular view of how different demographics are navigating the current fiscal landscape.