Liquidity Crunch Overrides Real Yields as Gold Plummets Amid Broad Market Deleveraging

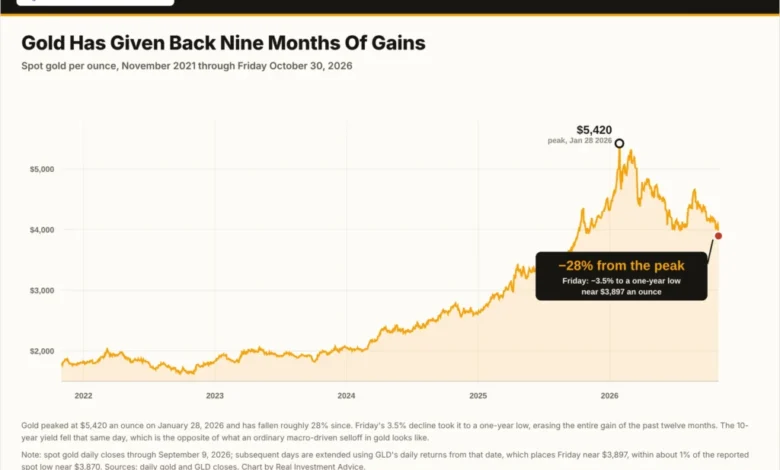
Financial markets frequently test conventional economic theories, and recent trading sessions have provided a textbook example of how sudden liquidity constraints can temporarily shatter long-standing correlations. Precious metals analysts and portfolio managers have long relied on the inverse relationship between gold and real yields—specifically, the yield on Treasury Inflation-Protected Securities (TIPS). However, a sharp market downturn disrupted this dynamic, leaving investors questioning why gold prices tumbled even as real yields drifted lower.

Understanding this divergence requires a detailed examination of how institutional liquidity, macroeconomic indicators, and market psychology interact during periods of systemic stress. While foundational models remain accurate over extended horizons, short-term dislocations often expose the vulnerabilities of treating any single asset class as a pure economic hedge.
The Foundation of the Gold-Real Yield Relationship
For decades, empirical data has demonstrated a robust negative correlation between gold and real yields. Between 2003 and 2021, this statistical relationship hovered near negative 0.84. The financial rationale underpinning this correlation is straightforward: because gold generates neither interest nor dividends, investors incur an opportunity cost by holding it rather than yield-bearing fixed-income instruments. When real yields rise, the opportunity cost increases, typically depressing gold prices. Conversely, falling real yields reduce that cost, providing a favorable tailwind for precious metals.

Furthermore, real yields serve as a primary indicator of Federal Reserve monetary policy. Elevated real yields suggest that the central bank is maintaining a restrictive policy stance to combat inflationary pressures. When real yields fall or enter negative territory, it signals accommodative monetary conditions that carry inflationary risks. Because a significant portion of the retail and institutional demand for gold stems from its reputation as an inflation hedge, the trajectory of Federal Reserve policy remains a critical variable for precious metals investors.
This traditional framework faced a severe test during 2024 and 2025. Despite persistently high real interest rates, gold staged a remarkable rally driven by aggressive central bank accumulation and heightened geopolitical tensions. These exogenous demand drivers temporarily overwhelmed the conventional negative correlation. Nevertheless, as real interest rates continued their upward trajectory, the underlying economic mechanics ultimately reasserted themselves, bringing the asset back into alignment with structural macroeconomic trends—until a broader market liquidity event altered the equation.

The Anatomy of a Liquidity Event
The recent sharp correction in precious metals highlighted a critical distinction between long-term valuation models and short-term market mechanics. The catalyst for the late-week sell-off originated not in the fixed-income or currency markets, but in the technology sector, where the Nasdaq dropped nearly 3% amid mounting skepticism regarding the immediate return on investment for artificial intelligence spending.
When major equity indexes experience sudden, sharp declines, leveraged market participants frequently face margin calls. Under severe portfolio pressure, institutional investors and hedge funds cannot always liquidate the specific assets they prefer to sell; instead, they are forced to sell whatever assets possess the highest market liquidity.
Gold ranks among the most liquid, globally traded assets in existence and serves universally accepted collateral. Consequently, during acute deleveraging cycles, precious metals are frequently sold to meet margin requirements elsewhere in the financial system. This dynamic is frequently exacerbated during month-end trading sessions, when institutional rebalancing and liquidity constraints are already elevated.
Market strategists emphasize a vital takeaway from this episode: while real yields explain Federal Reserve policy and dictate multi-year trends for gold, liquidity dynamics explain short-term divergences. An asset purchased as a long-term portfolio insurance policy can quickly be converted into a source of immediate liquidity to cover losses in riskier positions.

Seasonal Trends and Midterm Election Cycles
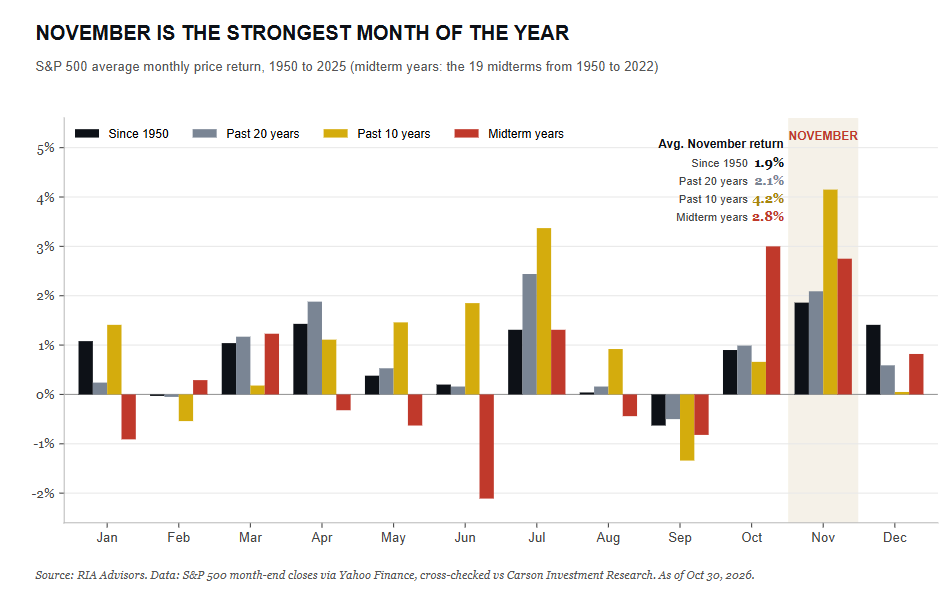
As financial markets navigate these crosscurrents, macroeconomic analysts are also turning their attention to broader seasonal patterns and the political landscape. Historically, November ranks as one of the strongest months of the year for U.S. equities. Since 1950, the S&P 500 has posted an average November gain of approximately 2%, with returns climbing even higher over the past decade. In historical midterm election years, the average November gain expands to roughly 2.7%.
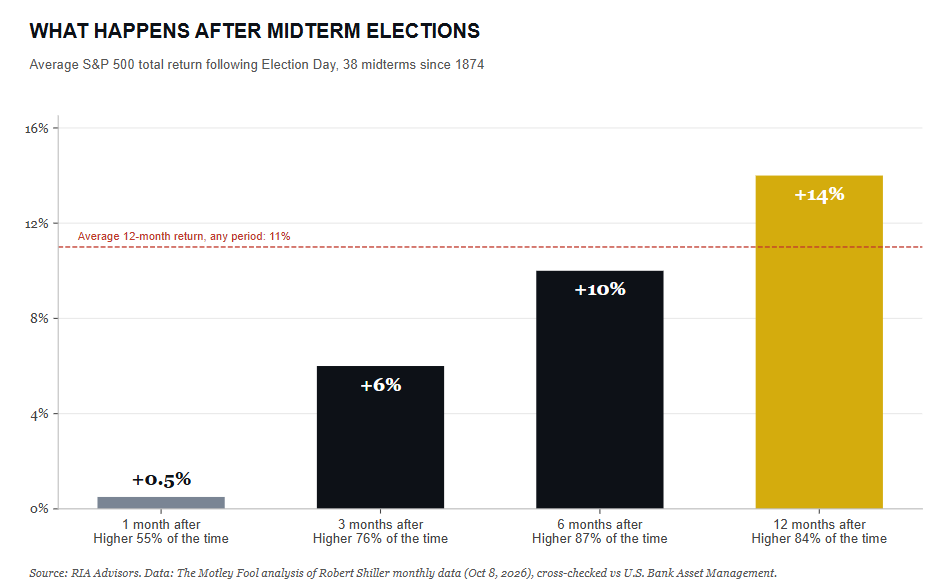
Midterm election years typically represent the most volatile phase of the four-year presidential cycle, characterized by an average peak-to-trough drawdown of approximately 18%. However, once the political uncertainty surrounding the ballot box is resolved, historical data indicates that markets frequently experience a relief rally. Since 1874, the S&P 500 has averaged a 6% gain in the three months immediately following a midterm election, and a 14% increase over the subsequent twelve months, posting positive returns in roughly 84% of those periods. Notably, since 1950, every single year following a midterm election has recorded positive overall performance.
Equally significant for market participants is the configuration of power in Washington. Historical analysis from major financial institutions indicates that equity markets have historically generated the strongest average annual returns under divided government, or political "gridlock." A setup featuring a split legislative and executive branch limits the likelihood of sudden, disruptive policy shifts, providing a stable environment for corporate planning and investment.
Sector Rotations and Growth Versus Value Dynamics
Beneath the headline index levels, portfolio managers continue to navigate tactical shifts between growth and value equities. Earlier in the autumn, quantitative factor models signaled that large-cap growth stocks had reached overbought extremes relative to large-cap value counterparts. This prompted institutional managers to trim growth exposure and reallocate capital toward value-oriented sectors.
Subsequent market performance validated these tactical adjustments. Over a trailing twenty-day window, large-cap growth benchmarks retreated significantly, while large-cap value indexes posted positive gains. Technology sectors experienced pronounced downward pressure, whereas select value sectors absorbed substantial capital inflows.
However, market breadth and momentum indicators suggest that this rotation toward value may be reaching its terminal phase. While certain defensive and value-oriented segments appear overbought, heavily penalized growth and communications sectors have seen their absolute and relative valuation scores adjust closer to historical norms. Portfolio managers note that upcoming employment reports and corporate earnings revisions will likely dictate the next phase of sector leadership, with quantitative models indicating a potential inflection point where investors begin favoring larger-cap growth equities once again.

Long-Term Investment Horizons and the Multi-Decade Outlook
The debate surrounding long-term return expectations remains a central theme for institutional asset allocators. Nearly a decade ago, prominent economic research organizations warned that the "golden era" of above-average equity returns had drawn to a close, citing plateauing profit margins, rising valuation multiples, and shifting macroeconomic baselines. Savers were advised that achieving long-term financial independence would require significantly higher savings rates or extended career timelines.
Subsequent market performance challenged those conservative projections. Over the ensuing decade, U.S. equities generated annualized returns substantially higher than anticipated, driven largely by sustained multiple expansion and corporate earnings resilience across dominant technology and consumer discretionary enterprises. Financial historians reviewing these long-term forecasts suggest that humility remains essential in wealth management; projecting structural shifts over ten-to-twenty-year horizons frequently founders on the shores of unforeseen technological innovation and monetary policy adjustments.

As investors digest these overlapping developments—ranging from the micro-mechanics of gold liquidity to the macro-implications of political gridlock and sector rotation—disciplined risk management remains paramount. Base rates and historical probabilities provide the statistical odds, but execution depends entirely on honoring predefined risk parameters and maintaining portfolio balance across all economic cycles.
Related posts: