The convergence of 5% Treasury yields, a depleted household savings cushion, and an aggressive Federal Reserve policy pivot has heightened the risk of severe economic over-tightening. Following the Federal Open Market Committee’s (FOMC) unanimous decision to raise the target federal funds rate to a range of 3.75% to 4.00%—its first hike since 2023—financial markets have reacted swiftly. The benchmark 10-year Treasury yield subsequently surged past 5.3%, marking its highest level since 2007. This dynamic has forced economists and portfolio managers to reevaluate the traditional mechanics of monetary policy transmission. With long-term borrowing costs already acting as an economic brake, additional interest rate hikes by the central bank threaten to accelerate financial strain faster than historical models typically predict.

The debate centers on whether traditional economic indicators accurately reflect the current vulnerabilities within the United States economy. While headline economic activity remains resilient, driven largely by capital expenditures in artificial intelligence and robust corporate earnings in specific sectors, structural shifts in consumer financing and asset dependence have altered the macroeconomic landscape. Analysts argue that the standard timeline between monetary policy tightening and economic contraction may be significantly compressed due to unique post-pandemic financial behaviors and elevated sovereign debt levels.
Economic Activity Versus Inflation Dynamics
A foundational argument supporting the Federal Reserve’s recent tightening cycle is the resilience of broad economic activity. Recent data from the Institute for Supply Management (ISM) showed the Services PMI registering at 54.9, with new orders hitting 59.8, while the manufacturing index held at 54.5. Traditionally, a composite PMI well above the 50-neutral threshold is viewed as a precursor to inflationary pressures, signaling robust aggregate demand that requires central bank intervention.
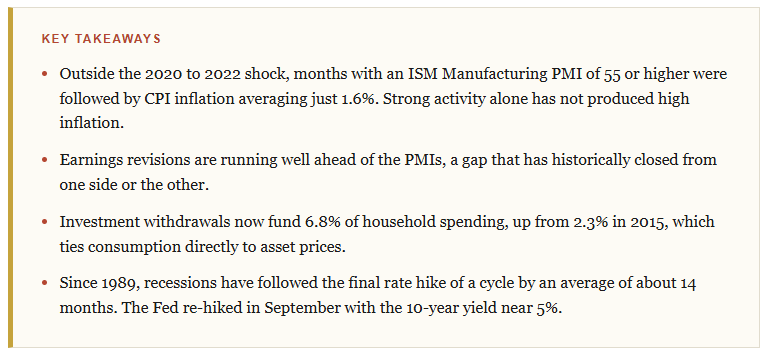
However, historical analysis of monthly ISM Manufacturing readings paired with Consumer Price Index (CPI) prints nine months later reveals a more nuanced relationship. Outside of the unique pandemic recovery window from mid-2020 to mid-2022—when direct fiscal stimulus collided with severely disrupted global supply chains—periods of strong economic activity have not reliably preceded runaway inflation. Specifically, historical data indicates that months featuring a PMI reading of 55 or higher were followed by an average inflation rate of just 1.6%.
This dichotomy highlights a critical distinction between "good" inflation, driven by capital expenditure and productivity-enhancing investments such as semiconductor shortages and AI infrastructure, and "bad" inflation, driven by energy cost spikes and supply bottlenecks. Headline CPI recently reached 3.7%, underpinned by energy prices running over 20% higher year-over-year. Because the Federal Reserve’s primary monetary tools operate strictly by cooling aggregate demand, additional rate hikes do little to resolve structural supply constraints or volatile energy costs. Instead, they disproportionately squeeze interest-sensitive sectors and consumers who rely heavily on debt financing.
Earnings Resilience and Market Concentration
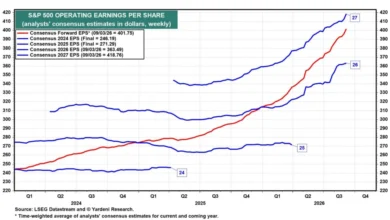
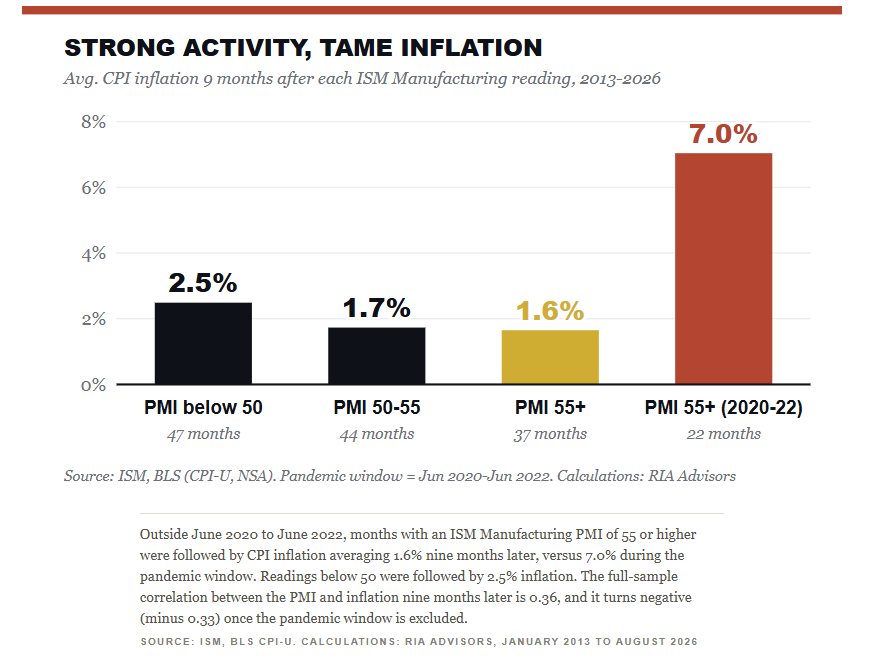
Corporate earnings reports have consistently outpaced broader macroeconomic indicators, creating a divergence between financial asset valuations and Main Street economic reality. Topdown Charts’ S&P 500 earnings revisions index recently surged to levels not seen since 2003, while broader economic indicators like the ISM composite index remain only modestly above historical norms.
This divergence is largely attributable to market concentration. Earnings revisions and cash flow growth are heavily concentrated in technology hyperscalers and capital-spending giants driving the artificial intelligence transition. These corporate entities sit on substantial cash reserves and are largely insulated from quarter-point adjustments in the federal funds rate. Conversely, smaller enterprises, debt-dependent cloud providers, and leveraged commercial entities face escalating borrowing costs that threaten profit margins and capital expansion plans.

During the FOMC policy deliberations, officials emphasized that productivity growth remains strong and capital investment robust. While accurate, this strength highlights a fundamental policy dilemma: the central bank is actively tightening monetary conditions in an economic segment that requires virtually no credit to expand, while simultaneously penalizing the segments of the economy that are heavily reliant on stable financing conditions. Furthermore, with the risk-free rate offering yields above 5%, the required return for equity multiples increases, risking valuation compression even as headline earnings hold steady—a dynamic mirrored during the 2022 market correction.
The Asset-Dependent Consumer and Depleted Savings
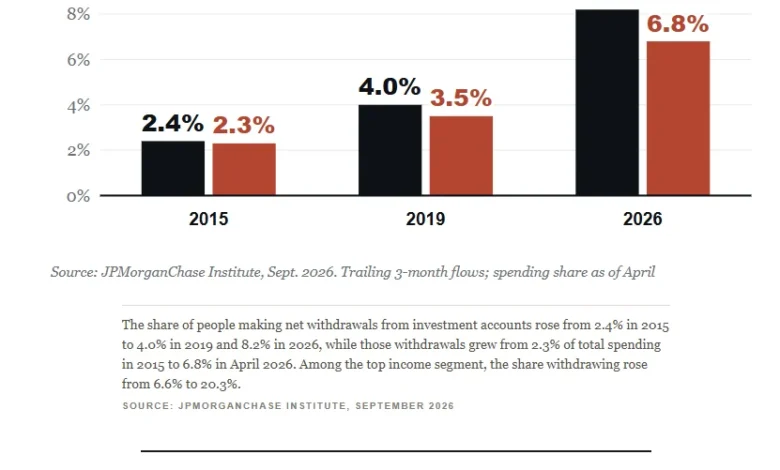
The most significant vulnerability in the current monetary cycle lies in consumer behavior and household balance sheets. Over the past fifteen years of prolonged low interest rates and quantitative easing, rising equity and housing markets quietly supplemented traditional wage growth. Data compiled by the JPMorganChase Institute utilizing checking account metrics across millions of customers quantifies this structural shift. Net transfers from investment accounts into checking accounts funded 2.3% of total household spending in 2015. By April 2019, that figure rose to 3.5%, and by April 2026, it reached 6.8%.
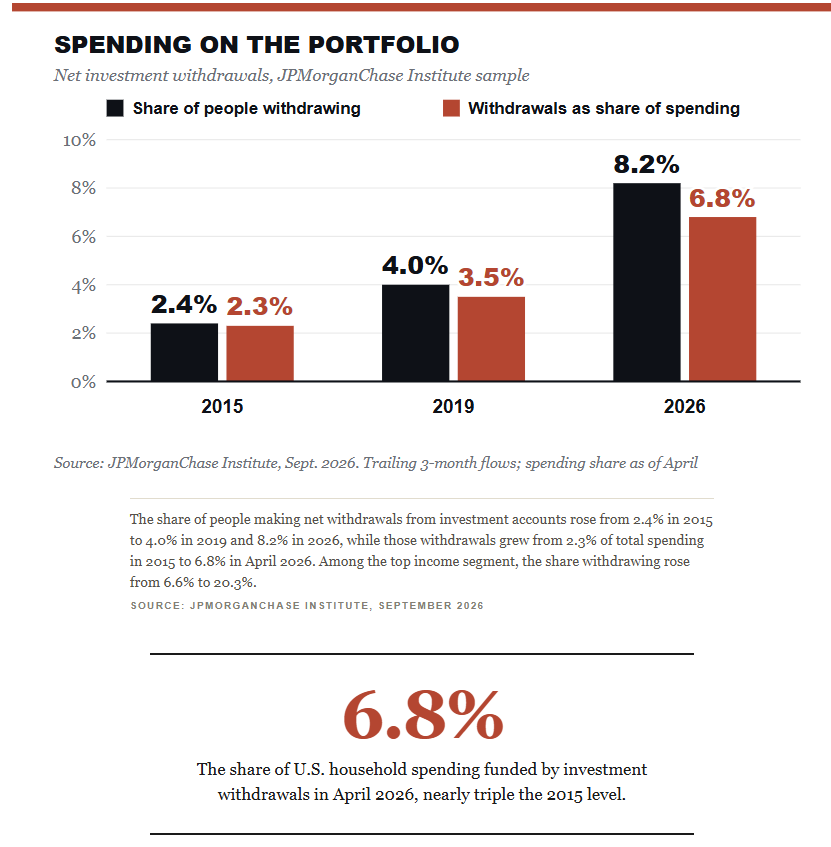
This metric illustrates that for every dollar spent by American households, nearly 7 cents derived from the liquidation of stocks, bonds, and mutual funds rather than direct earned income. Among top income earners, who account for roughly half of all consumer spending according to Moody’s, investment withdrawals have funded more than 10% of monthly expenditures. Simultaneously, the personal saving rate has compressed to approximately 4.1%, leaving the bottom half of earners with virtually no financial buffer.
This asset-dependent spending model introduces a novel transmission channel for monetary policy. As higher interest rates pressure equity valuations and fixed-income assets, household portfolio values decline, prompting a reduction in discretionary investment liquidations. Consequently, consumer spending contracts. This suggests that a future economic downturn may not originate from traditional labor market weakness or sudden spikes in unemployment, but rather from an asset market correction that abruptly curtails spending among high-income demographics.
Historical Precedents and Policy Lags
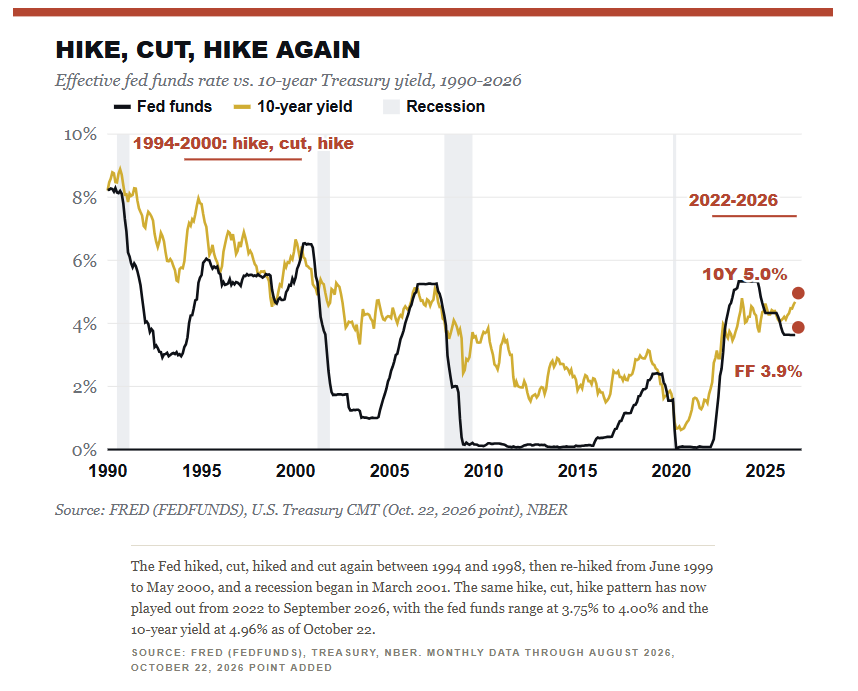
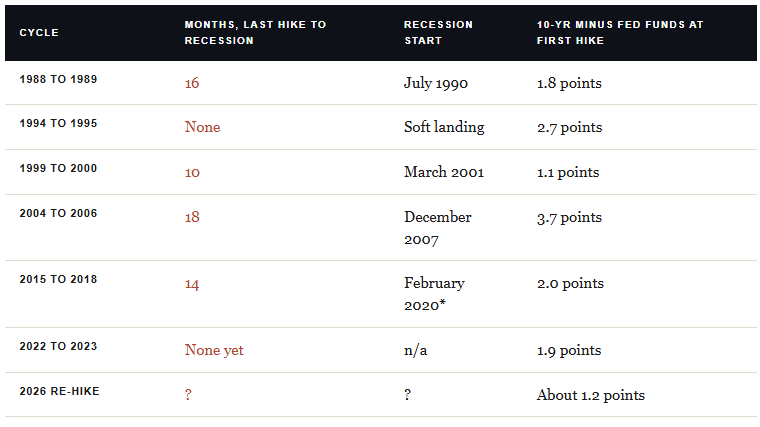
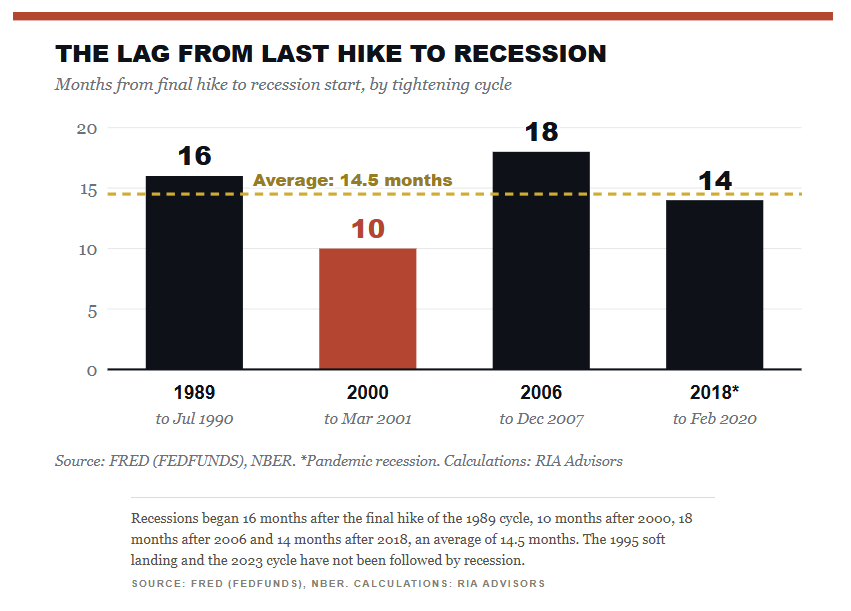
Evaluating historical tightening cycles provides a framework for assessing how much runway remains before monetary policy induces a recession. Following the 1991 recession, the Federal Reserve executed a series of aggressive adjustments, hiking rates in 1994, cutting in 1995 and 1996, pausing, and eventually re-hiking 175 basis points between June 1999 and May 2000. That cycle culminated in a recession in March 2001—roughly 21 months after the initial re-hike and just 10 months after the final rate increase. The current policy trajectory mirrors this sequence, featuring rate hikes in 2022 and 2023, subsequent easing phases in 2024 and 2025, and renewed tightening in late 2026.
Historically, the average lag between the final rate hike of a tightening cycle and the onset of a recession has been approximately 14 months, with a historical range spanning 10 to 18 months. However, economists caution against relying strictly on historical averages for the current cycle. With the 10-year Treasury yield trading near 5.3%, mortgage rates, corporate debt issuance, and consumer borrowing costs reflect a significantly tighter monetary stance than the nominal federal funds rate implies.
When factoring in an asset-dependent consumer base and record levels of sovereign and corporate debt accumulated during the era of zero-interest-rate policy, the traditional monetary lag is expected to shorten. Normal interest rates applied to a vastly expanded debt stock do not yield normal historical outcomes. Consequently, additional rate hikes compound the risk of over-tightening at an accelerated pace, leaving a much narrower margin for error than standard macroeconomic models project.
Implications for Investors and Portfolio Management
For institutional and retail investors alike, the primary takeaway from the current macroeconomic environment involves risk management and portfolio positioning. While bullish analysts point to historical soft-landing precedents—such as the successful navigation of the 1995 monetary adjustment—and secular tailwinds from productivity and artificial intelligence investments, the structural vulnerabilities in consumer spending and debt servicing cannot be ignored.
Experienced asset managers emphasize that while predicting the exact timing of an economic downturn remains elusive, portfolios can be structured to withstand heightened policy risks. The asset-price channel of monetary transmission dictates that a 10% to 15% correction in equity markets would have a disproportionately severe impact on aggregate demand compared to previous cycles, directly suppressing consumption among top-tier income cohorts.
Key economic indicators to monitor moving forward include the sustained trajectory of the 10-year Treasury yield relative to the 5% threshold, ISM employment sub-indexes, monthly household investment liquidation metrics, and shifts in the personal saving rate. As long-term borrowing costs continue to filter through housing and corporate refinancing markets with a lag, the risk profile of additional monetary tightening shifts from inflation control to policy-induced economic contraction.