Markets Test Key Support Amid Rising Crude Prices and Federal Reserve Rate Decision Anticipation

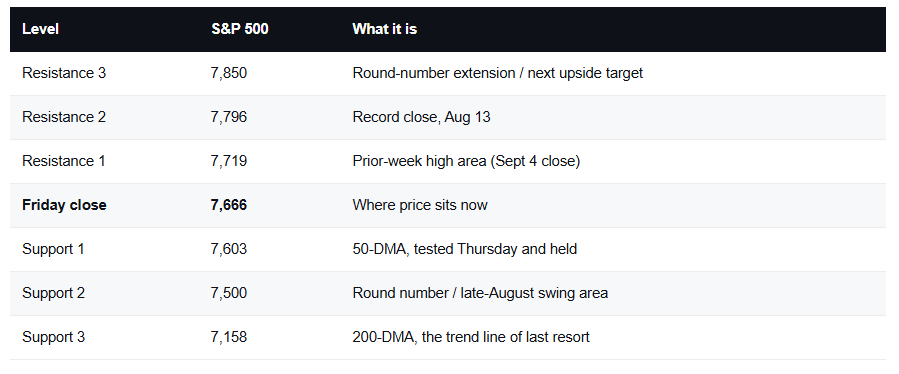
September has once again lived up to its historical reputation as a challenging month for equities, with the S&P 500 slipping to test its 50-day moving average. As the broader market absorbs fluctuating macroeconomic data, commodity shocks, and shifts in institutional capital flows, investors find themselves navigating a complex intersection of monetary policy expectations and technical market adjustments. The recent market pullback, highlighted by a 0.68% dip in the S&P 500 to close the week at 7,666, underscores an underlying fragility driven by narrowing market leadership and sensitive rate dynamics.
Market Brief and Cross-Asset Dynamics
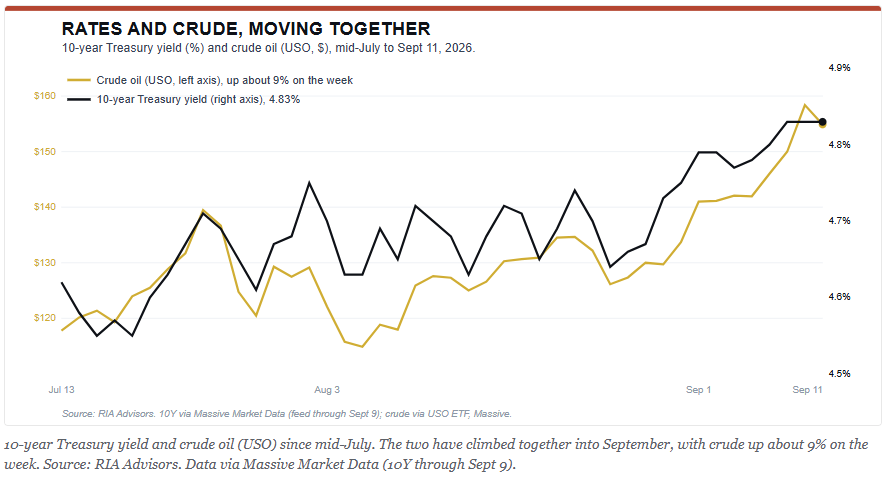
The primary driver behind the recent market positioning has been the surge in crude oil prices, which climbed approximately 9% over a four-session window. This energy spike directly influenced the 10-year Treasury yield, pushing it closer to the critical 5% threshold. Consequently, rate-sensitive corners of the equity market faced significant downward pressure. Small-cap stocks dropped 2.38%, the Dow Jones Industrial Average fell 1.51%, and the equal-weight S&P index declined 1.87%. By contrast, the cap-weighted S&P index and the Nasdaq-100 proved far more resilient, shedding less than a point and 0.52%, respectively.
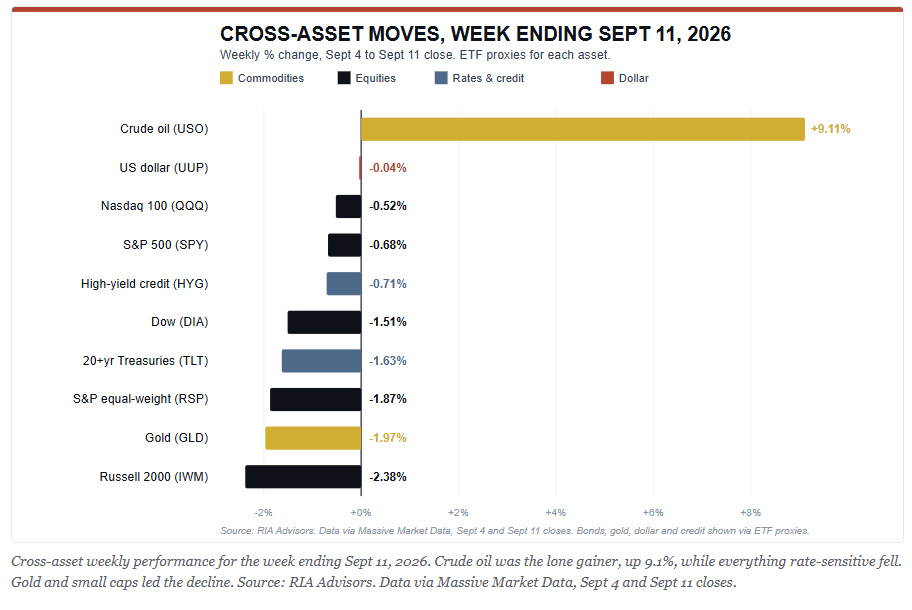
This divergence highlights a narrowing market breadth, wherein the average stock has underperformed significantly compared to the headline indices. Cross-asset reactions reflected a classic "rate scare" environment: gold prices moved lower, the U.S. dollar remained relatively flat, and market volatility ticked up from cyclical lows without signaling outright panic. Analysts note that while the headline figures appear manageable, the concentration of market gains in a handful of mega-cap technology and artificial intelligence (AI) names leaves little margin for error.
Inflation Data and the Federal Reserve Outlook
The macroeconomic backdrop was dominated by the release of fresh inflation figures, which provided the bond market with justification for higher yields. Headline Consumer Price Index (CPI) inflation printed at 3.4% year-over-year, demonstrating ongoing stickiness, while core CPI held at 2.4%, remaining slightly above the Federal Reserve’s long-term target.
Producer Price Index (PPI) data revealed more pronounced pressures, with monthly PPI jumping 0.4% and the annual rate accelerating to 5.4% from 4.8%. Much of this acceleration was fueled by goods pricing, led by a sharp 1.1% increase overall and a 24% surge in diesel prices alone. However, financial economists emphasize that this inflation pulse stems primarily from an exogenous oil shock rather than an overheating domestic economy. Because an energy-driven spike does not inherently justify a central bank rate hike—unlike broad demand-driven overheating—market participants are closely evaluating the Federal Open Market Committee’s (FOMC) upcoming policy meeting.
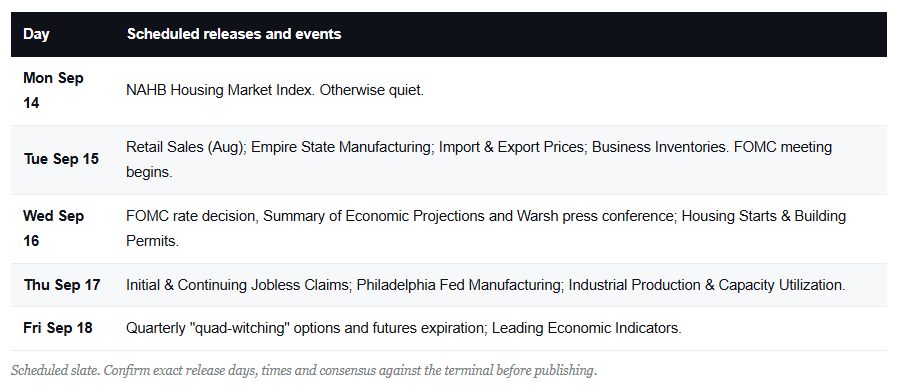
The FOMC is scheduled to convene on Tuesday and Wednesday, with interest rate futures indicating that market participants are leaning toward a potential quarter-point rate adjustment. Economists point out that hiking into an environment characterized by sticky headline inflation driven by temporary commodity spikes, combined with a gradually softening labor market, presents a delicate communication challenge for central bank officials.

Technical Backdrop and Institutional Positioning
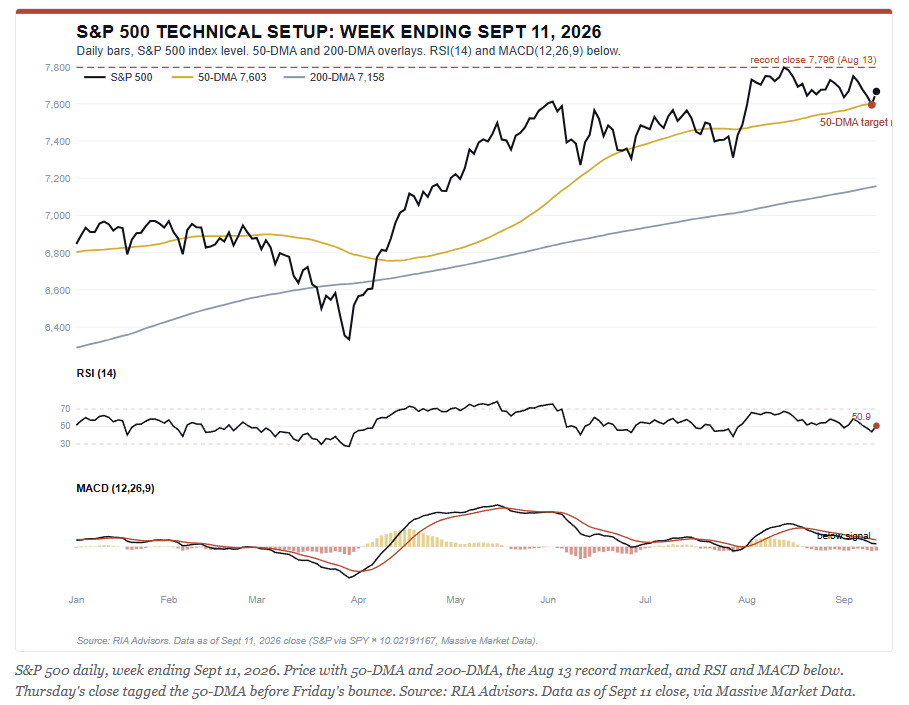
From a technical perspective, the recent correction in the S&P 500 successfully tested its initial downside target by touching 7,595 on Thursday before recovering to close near its 50-day moving average of 7,600. Despite holding this critical support line, underlying momentum indicators suggest caution. The Relative Strength Index (RSI) has eased to a neutral 50.9, while the Moving Average Convergence Divergence (MACD) signal line has crossed below its threshold, accompanied by a negative histogram.
Institutional positioning metrics compiled through the Money Flow Breadth Ratio (MFBR) indicate that equity allocations are currently undergoing a period of overbought reversion. Standing at 70%, down from recent peaks, the MFBR model suggests that the recent market strength should be utilized for risk management and portfolio rebalancing rather than aggressive accumulation. Historical backtesting of similar stretched breadth readings indicates that short-term forward returns can experience localized downward pressure, reinforcing the rationale for maintaining disciplined exit strategies and holding cash reserves.

Upcoming Catalysts and Macroeconomic Calendar
The upcoming week features major catalysts capable of establishing the trading tone for the remainder of the quarter. The central bank’s policy announcement on Wednesday afternoon will be accompanied by updated economic projections and a press conference. Market participants will scrutinize the messaging for any signs of internal dissent regarding the trajectory of monetary policy.

In addition to monetary policy, Friday marks a record-sized quarterly options and futures expiration event, commonly referred to as "quad-witching." Given the substantial growth in derivatives trading over recent years, these massive expirations frequently pin asset prices to specific strike levels before triggering outsized directional moves once cleared.

The economic data calendar is heavily populated throughout the week, featuring reports on retail sales, industrial production, housing starts, regional manufacturing surveys, and weekly initial jobless claims. Retail sales figures will receive particular attention as a gauge of consumer resilience, which remains a foundational pillar of the broader economic soft-landing narrative. Corporate earnings reports are comparatively light, though logistics giant FedEx is slated to report, providing institutional investors with a reliable proxy for global shipping demand and industrial economic activity.

Long-Term Valuation and Structural Market Trends
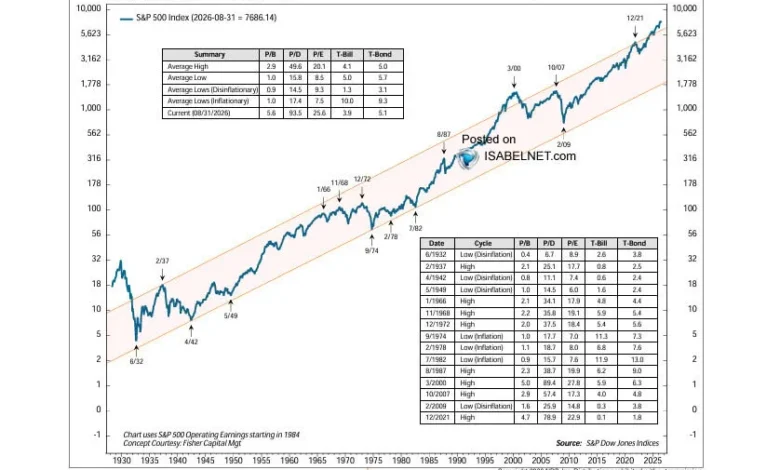
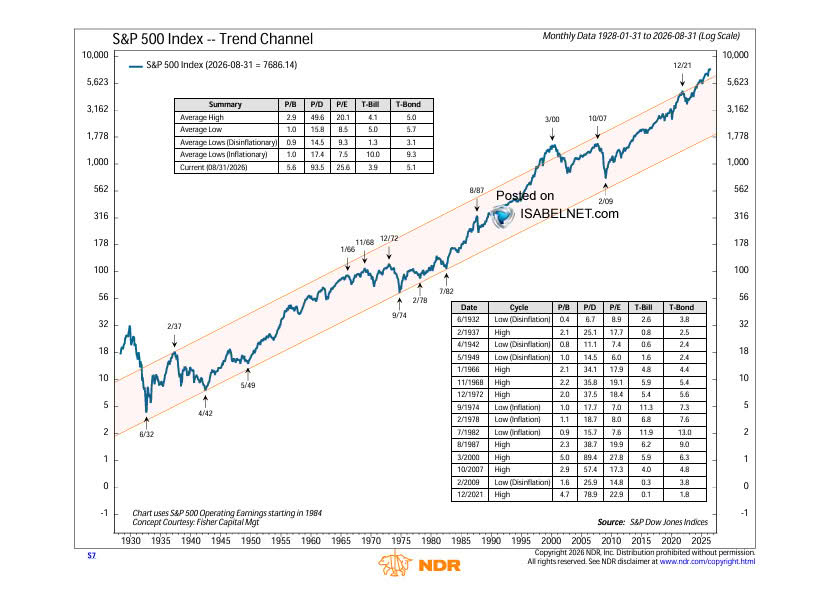
Beyond immediate trading catalysts, analysts continue to debate the sustainability of current equity valuations against long-term historical precedents. Data from institutions such as Ned Davis Research highlights that the market is trading above the upper limit of its long-term trend channel on a logarithmic scale, an extreme last observed prior to the dot-com peak in early 2000. Furthermore, corporate earnings have broken above a multi-decade structural trend channel, prompting debates over whether technological advancements like artificial intelligence justify a permanent paradigm shift or if traditional mean reversion will eventually take hold.

Proponents of the bull case point out that second-quarter S&P 500 earnings grew approximately 31% year-over-year on an adjusted basis, significantly outperforming consensus estimates. While AI infrastructure spending by major hyperscalers accounts for a substantial share of this growth, broad-based earnings expansion across the remaining index constituents indicates a more synchronized corporate recovery than previously observed. Furthermore, elevated short interest and sidelined cash reserves provide potential liquidity fuels that could sustain the market’s upward trajectory in the near term.
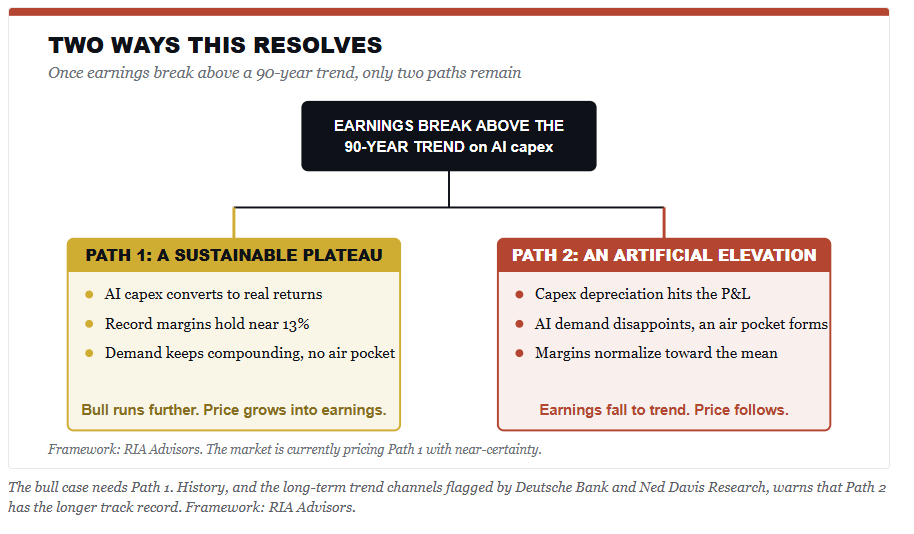
Conversely, risk-conscious strategists emphasize that current price-to-earnings multiples are resting on cyclical peak earnings. With the Shiller Cyclically Adjusted Price Earnings (CAPE) ratio positioned near historically elevated percentile bands, projected forward returns over the next decade face mathematical headwinds. Following Bob Farrell’s foundational market rules, exponential moves often extend further than anticipated but rarely resolve through sideways consolidation alone.
Portfolio Risk Management and Strategic Implications
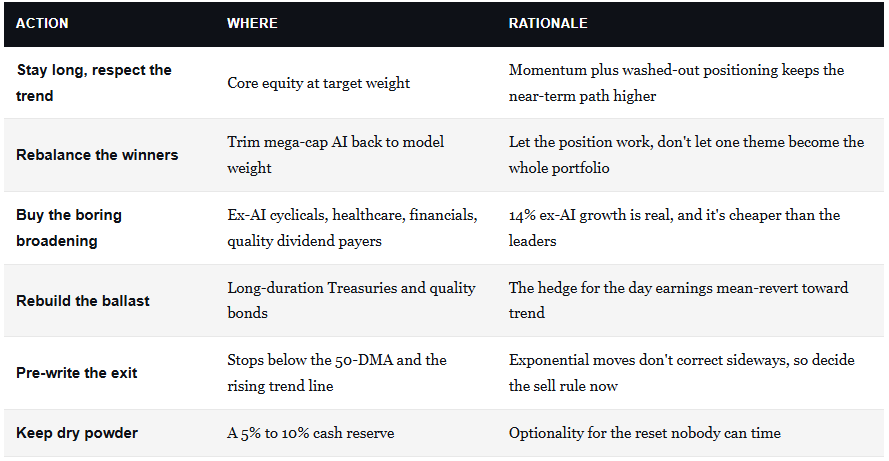
As institutional asset managers and individual investors evaluate these opposing forces, the prevailing recommendation centers on balanced risk management. Market participants are advised to allow existing equity trends to run while systematically trimming extended winners back to target model weights during periods of market strength. Maintaining exposure to cash and fixed-income assets provides a structural buffer against potential volatility, ensuring that portfolios remain resilient regardless of how macroeconomic and technical signals resolve in the fourth quarter.
Related posts: