Momentum Meltdown and Oil Spikes Trigger Historic Market Rotation as AI Premium Faces First Major Test

The global financial markets experienced a significant structural shift this week as a historic "momentum meltdown" tore through the equity market’s most crowded trades, even as headline indices masked the underlying volatility. While the benchmark S&P 500 slipped a relatively modest 1.5% to close at 7,457.69, the action beneath the surface told a story of aggressive capital reallocation. The technology-heavy Nasdaq 100 retreated by approximately 4%, while the Dow Jones Industrial Average remained comparatively resilient with only a fractional loss. This divergence highlights a violent unwinding of the artificial intelligence and semiconductor narrative that has dominated investor sentiment throughout much of 2026.
The Anatomy of a Historic Momentum Meltdown
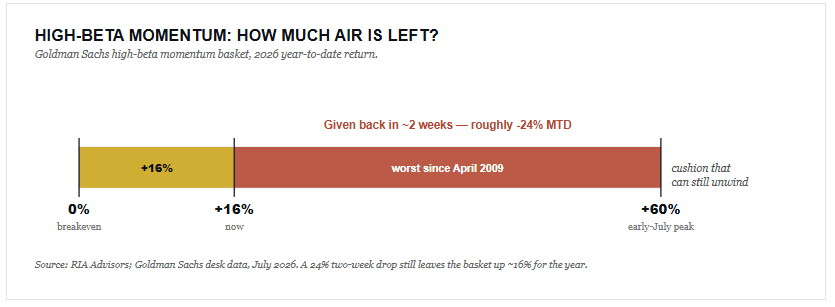
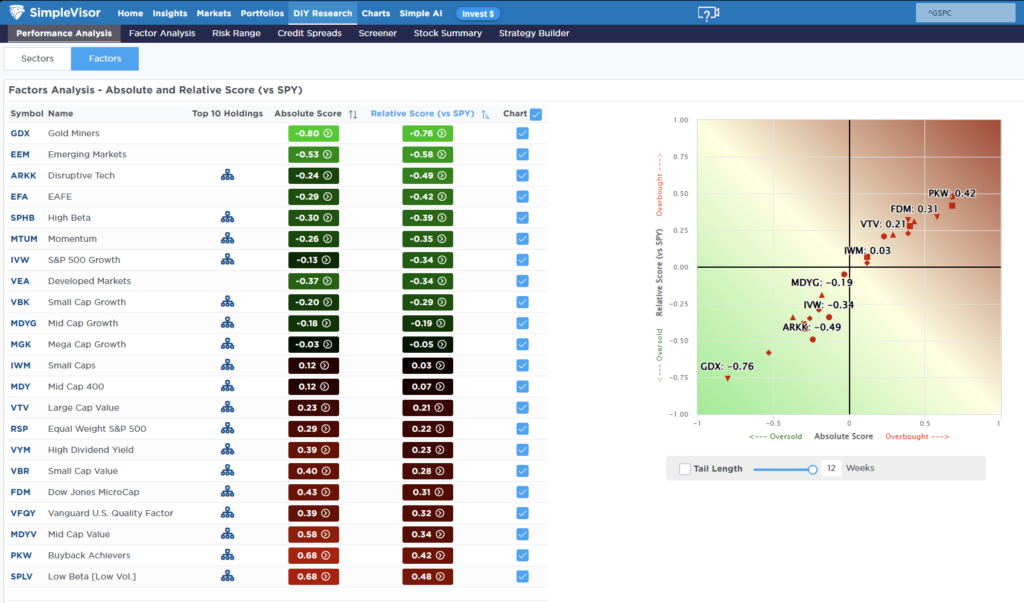
Underneath the seemingly calm surface of the major indices, one of the most concentrated trades in financial history began to disintegrate. According to data from Goldman Sachs, the firm’s high-beta momentum basket fell by approximately 24% month-to-date through the first half of July. This represents the worst stretch for the factor since the depths of the Great Financial Crisis in April 2009. Further compounding this narrative, Morgan Stanley’s tech momentum index posted a 17-day rate of change of -35%, the most severe reading in the 27 years the desk has tracked the metric.
This reversal marks the end of the "parabolic" phase for the semiconductor complex, which many analysts had warned was overdue for a correction. The scale of the give-back is historic: Goldman’s flagship momentum pair is now down roughly 33% from its recent peaks, breaking below its 200-day moving average. However, context remains critical for long-term investors; despite the recent 24% drop, the high-beta momentum basket remains up 16% for the year, having peaked at a staggering 60% gain earlier in the summer. This suggests the current movement is a violent return to mean rather than a fundamental collapse of the asset class.
The Triple Catalyst: China, Semiconductors, and Geopolitics
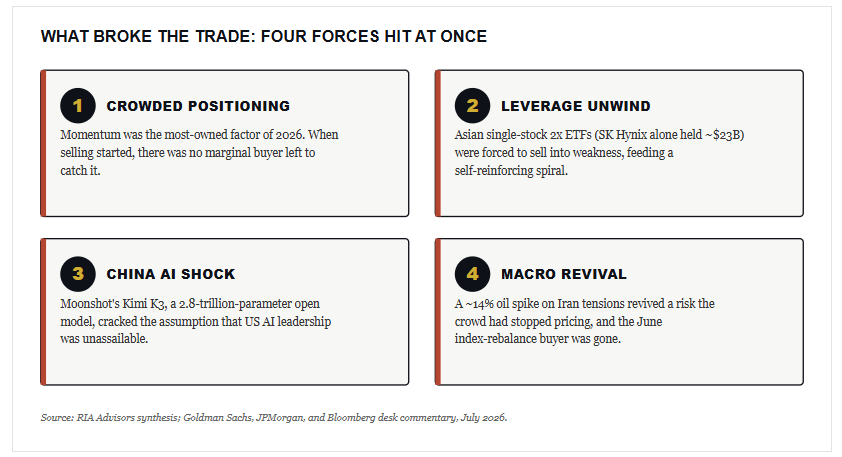
The catalyst for this week’s rotation was not a single event but a convergence of three distinct forces that hit the market simultaneously, catching leveraged investors off guard.
First, the "American AI premium" faced a direct challenge from abroad. China’s Moonshot AI unveiled Kimi K3, a 2.8-trillion-parameter open-weight model. Benchmarks indicated that the system performs closely to leading U.S.-developed models but at a significantly lower operational cost. This development reignited fears regarding the long-term durability of the profit margins currently enjoyed by U.S. chipmakers and software developers.
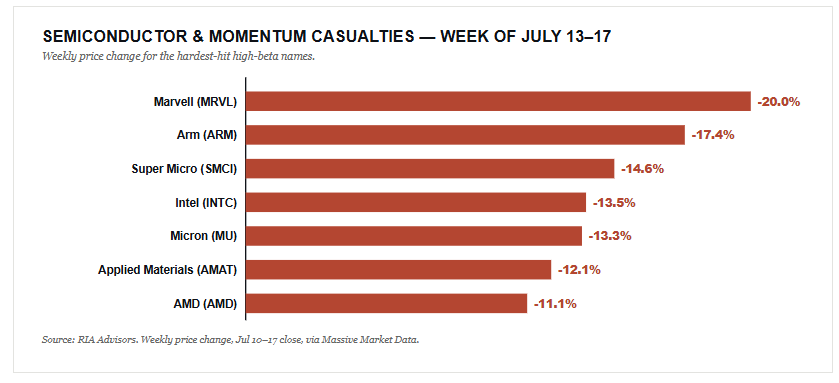
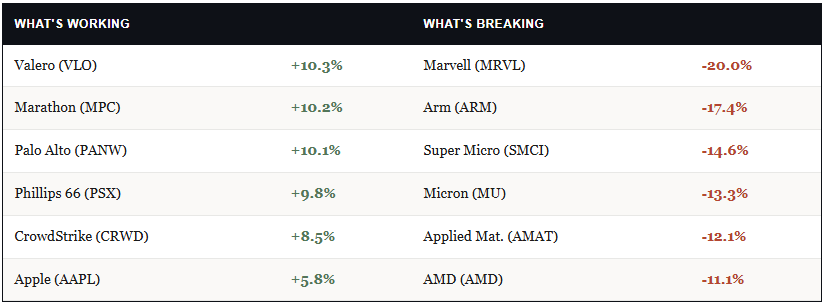
Consequently, the Philadelphia Semiconductor Index (SOX) bore the brunt of the selling pressure, dropping more than 10% on the week. The index now sits nearly 20% below its June high, a threshold that technically defines a bear market for the sector. Individual losses were even more pronounced: Marvell Technology fell 20%, Arm Holdings dropped 17%, and Micron Technology lost 13%.

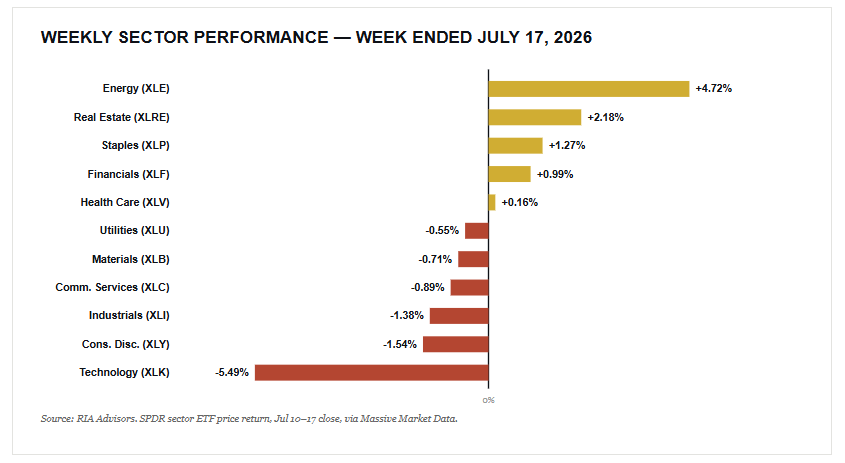
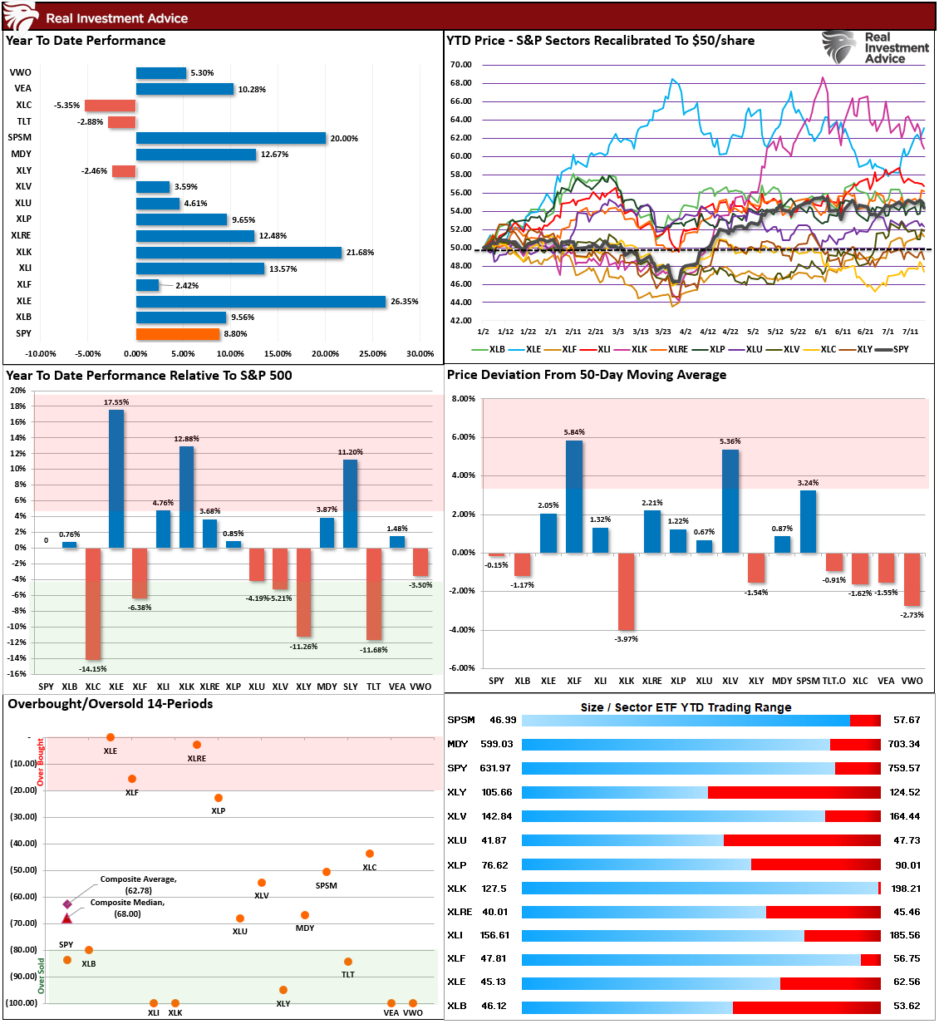
Second, the energy sector provided a sharp counterpoint to the tech selloff. Renewed strikes involving U.S. and Iranian interests sent energy prices soaring. West Texas Intermediate (WTI) crude oil rose approximately 14% on the week, while Brent crude climbed more than 15%. This geopolitical friction handed the Energy sector a 4.7% weekly gain, making it the top-performing group on the S&P 500 sector board.
Third, a positioning squeeze in Asia exacerbated the volatility. In markets like South Korea, single-stock leveraged Exchange Traded Funds (ETFs) tied to names like SK Hynix had reached record levels of retail participation. As underlying prices began to dip, these funds were forced to sell assets to maintain their mandated 2x exposure, creating a self-reinforcing downward spiral. In response, Korean regulators moved to halt the listing of new leveraged products midweek to stem the systemic risk.
Technical Indicators: A Market at the Crossroads
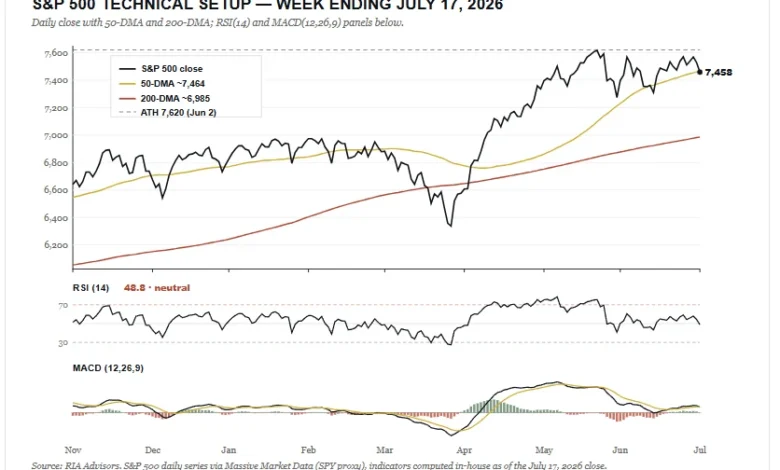
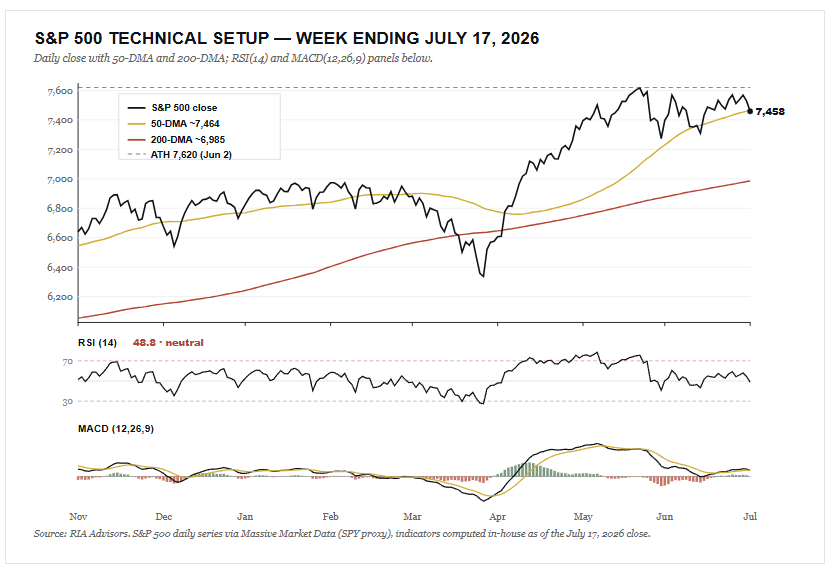
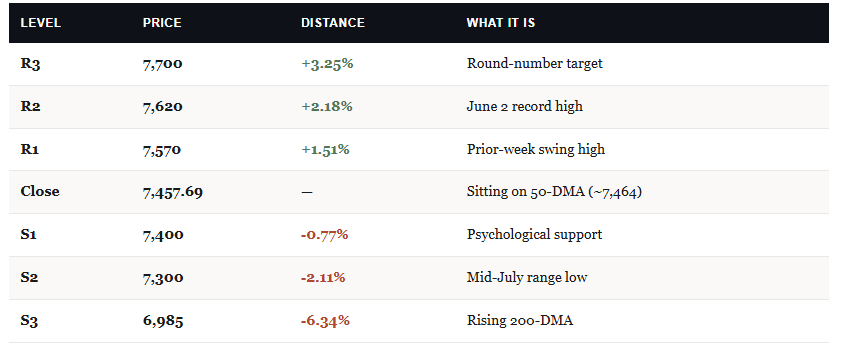
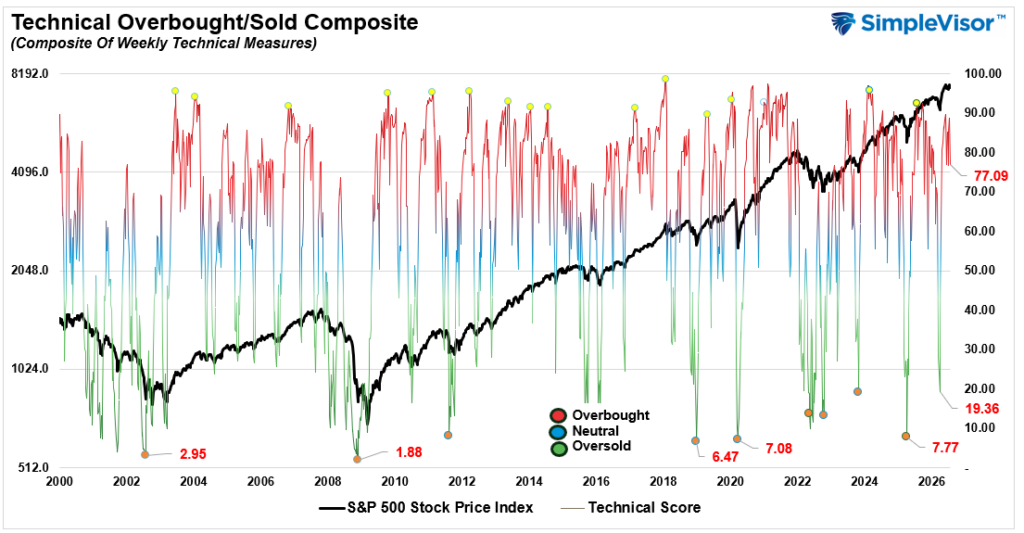
From a technical perspective, the S&P 500 is currently "coiling" just below its record highs. The index closed the week at 7,457.69, placing it exactly on its 50-day moving average of 7,464. This "dead flat" positioning against a key trendline suggests a market searching for its next directional lead. While the primary uptrend remains intact—the index still sits 6.8% above its 200-day moving average of 6,985—short-term momentum indicators have turned defensive.
The Moving Average Convergence Divergence (MACD) has rolled below its signal line for the first time since the April market lows, and the histogram has flipped negative. While a single bearish crossover is rarely a standalone sell signal, it serves as a significant warning that a deeper correction may be building. Meanwhile, the 14-day Relative Strength Index (RSI) for the S&P 500 sits at 48.8, a neutral reading that suggests the broad market is neither overbought nor oversold. This contrasts sharply with the Momentum ETF (MTUM), which printed an RSI of 41, reflecting the specific pain felt by trend-following investors.
The Quality of Earnings and the AI Fatigue Narrative
As the market transitions into the heart of the earnings season, a growing debate regarding "earnings quality" has emerged. Analysts have noted that the recent rally in mega-cap tech was supported by accounting dynamics that may not be sustainable. For instance, Alphabet’s record-breaking first-quarter results were significantly flattered by tens of billions of dollars in mark-to-market gains from its private stakes in Anthropic and SpaceX. Excluding these paper gains, the company’s operating numbers would have narrowly missed consensus estimates.
Furthermore, there are concerns regarding how "hyperscalers"—the massive cloud providers like Microsoft, Amazon, and Google—are depreciating their AI-related capital expenditures. By using long depreciation schedules for chips and data centers, these companies may be inflating near-term margins while deferring the true cost of the AI buildout.
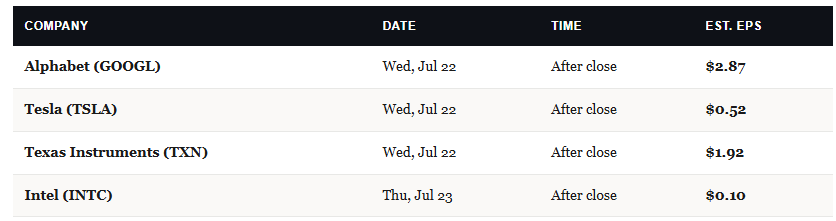
Economist Ed Yardeni has described the current sentiment as "AI Fatigue." Investors are increasingly moving away from buying stocks based on capital expenditure headlines and are instead demanding proof of cash flow and revenue generation from AI investments. This shift in focus puts immense pressure on upcoming reports from Alphabet, Tesla, and Texas Instruments.

Macroeconomic Backdrop and the Federal Reserve Blackout
The macroeconomic environment has also shifted against the momentum trade. During his recent testimony to Congress, Kevin Warsh emphasized that the Federal Reserve has "no tolerance for persistently elevated inflation." Warsh’s refusal to offer forward guidance has introduced a new layer of policy uncertainty. While the June Consumer Price Index (CPI) showed a monthly decline of 0.4%, the Federal Open Market Committee (FOMC) remains divided on whether to cut rates or hold steady in September.

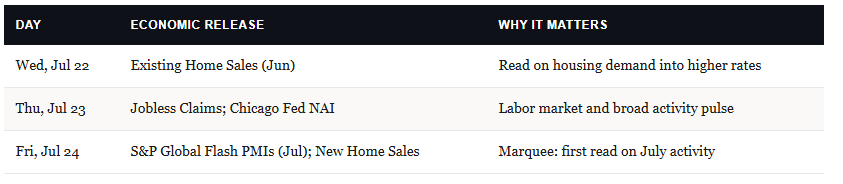
With the Fed entering its traditional "blackout window" ahead of the July 28–29 meeting, there will be no official speakers to soothe market nerves. This leaves the market vulnerable to data surprises, such as the Friday flash Purchasing Managers’ Index (PMI) readings, which will provide the first glimpse into how business activity is responding to recent oil price spikes and equity market volatility.
Broader Economic Implications: Real Estate and Consumer Sentiment
While the stock market grapples with rotation, the broader economy shows signs of mixed resilience. A bright spot for the American consumer arrived on Friday, as the University of Michigan’s preliminary July sentiment reading jumped to 54.4 from 49.5. This improvement was largely attributed to a temporary cooling of gasoline prices earlier in the month, though the more recent 14% spike in crude oil may reverse this optimism in the coming weeks.
In the housing market, a parallel narrative is unfolding. Despite headlines suggesting a generation has been locked out of homeownership due to affordability issues, a deeper analysis of the "actual payment" data suggests a more nuanced reality. While nominal prices remain high, the percentage of household income dedicated to servicing mortgage debt has not yet reached the catastrophic levels seen in previous housing bubbles, providing a potential floor for domestic economic stability.
Outlook: Rotation, Not Collapse
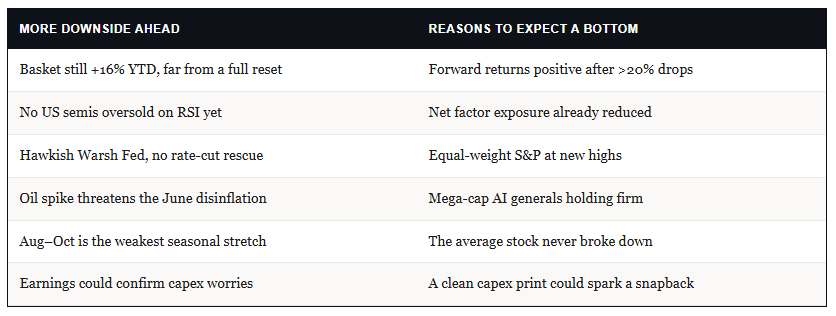
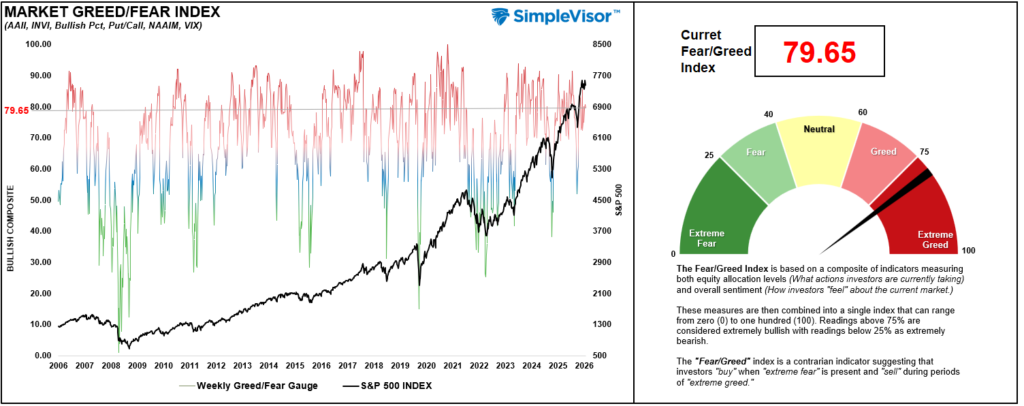
The prevailing consensus among market strategists is that the current volatility represents a "rotation" rather than a fundamental "collapse." This is evidenced by the fact that the equal-weight S&P 500 fell less than 0.5% this week and even touched a new all-time high on Wednesday. Defensive and cyclical value groups, including real estate, staples, and financials, all finished the week in positive territory.
However, history suggests that leadership changes in the stock market are a process that takes months to resolve, not days. The "momentum shift" away from a narrow band of high-beta semiconductors toward the broader market is likely in its early stages. August through October has historically been the weakest stretch of the year for equities, and the added uncertainty of the upcoming mid-term elections may prolong the period of price discovery.
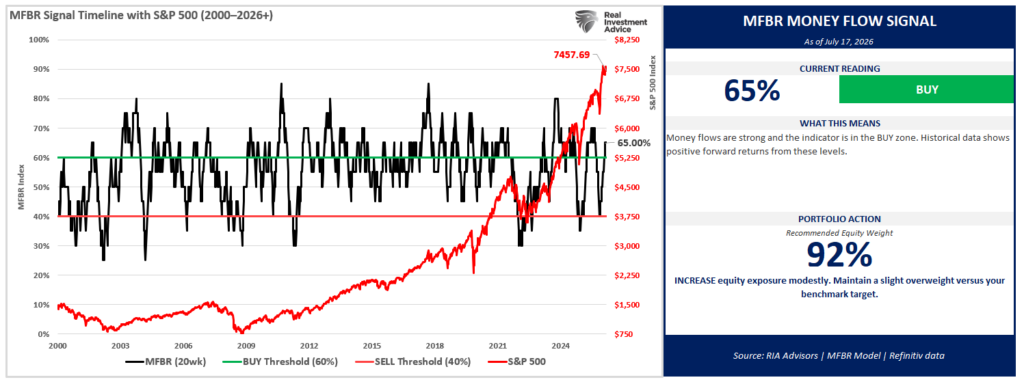
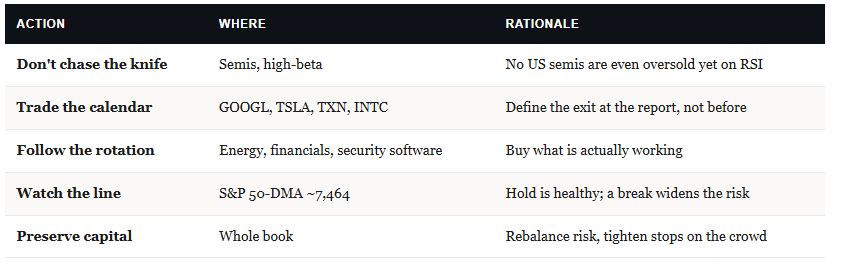
Investors are currently being advised to prioritize capital preservation and risk rebalancing. With the S&P 500 sitting on its 50-day moving average and mega-cap earnings on the horizon, the burden of proof remains on the "bulls" to hold key technical levels. If the upcoming earnings reports from the AI "generals" like Alphabet confirm capex and cash-flow concerns, the momentum meltdown could enter a second, more painful leg. Conversely, a clean set of results could provide the catalyst for an oversold snapback in the technology sector. In either scenario, the era of "perfection pricing" for AI names appears to have reached a definitive conclusion.