Statistical Arbitrage for Independent Traders: A Deep Dive into Triangulated Strategies

Statistical arbitrage, often shortened to "stat arb," is a trading strategy that hinges on the principle of convergence. At its core, it involves identifying two or more related financial instruments whose prices have temporarily diverged from their historical relationship and betting on their eventual return to their expected correlation. While pairs trading is the most well-known manifestation of this concept, its inherent capital inefficiency often poses a significant hurdle for individual traders. This article delves into a more sophisticated approach, Triangulated Statistical Arbitrage, which aims to overcome these limitations by constructing a robust universe of trading pairs, flattening these relationships into per-ticker views, and aggregating signals across multiple pairs to pinpoint mispriced individual securities. This method allows independent traders to operate a portfolio of individual tickers rather than being constrained by the pairwise relationships.
The methodology behind Triangulated Stat Arb, as detailed in prior discussions, rests on three foundational pillars: the meticulous selection of high-quality trading pairs, a triangulation and consistency-based approach to extract optimal signals, and the incorporation of external data such as volume, news, and event information to mitigate risks and avoid deceptive divergences. This installment will explore how these three components, when properly resourced, contribute to a more effective and scalable statistical arbitrage strategy for independent traders.
It is important to note that this analysis will focus on the conceptual framework and the underlying principles of the methodology rather than providing specific implementation details. The broad approach is designed to be generalizable, empowering traders to adapt it to their unique objectives and operational constraints. The precise filters, scoring weights, and cutoff thresholds are operational choices that are best kept proprietary and tailored to individual circumstances.
Furthermore, a crucial aspect of this methodology is the clear hierarchy of impact. Not all three pieces carry equal weight in driving performance. Understanding which components contribute the most significant "bang for the buck" is essential for optimizing resource allocation, particularly for solo traders where operational overhead must be carefully managed. For context, the production version of this strategy has been live-traded for several months, providing real-world validation of the discussed principles.
The Bedrock of Reliability: Selecting High-Quality Pairs
The initial and most critical step in any statistical arbitrage strategy is the selection of a high-caliber universe of trading pairs. This phase is the primary driver of the strategy’s success; a flawed foundation of pairs will render subsequent analytical steps ineffective. Conversely, a well-curated universe of reliable pairs lays the groundwork for significant value creation through further analysis.
Within this framework, a pair’s quality is rigorously defined by two key metrics. The first metric quantifies the potential for profitable mean reversion over a specified lookback window, assuming frictionless trading conditions. Essentially, it asks: if we could execute trades instantaneously and without cost, would buying the relatively undervalued asset and selling the overvalued one generate positive returns? Pairs that exhibit persistent divergence, failing to revert to their historical mean, will register low or negative reversion-factor scores, marking them for exclusion.
The second metric assesses the consistency of the spread’s convergence after a divergence has occurred. It differentiates between spreads that simply drift apart for the entire observation period and then coincidentally snap back at the end, versus those that demonstrate a reliable tendency to revert to their mean following a period of deviation.
By combining these two metrics, a robust filter is established to identify pairs of stocks that reliably exhibit the desired behavior: a tendency to diverge and then converge sufficiently to be traded profitably. This direct measurement of the desired trading characteristic contrasts with more traditional approaches, such as solely relying on cointegration tests, which may not always capture the practical profitability of a pair.

Further insights into this pair selection methodology can be found in the article "Moneyball — Finding Undervalued Pairs Using Unconventional Metrics." Typically, the top 10% of pairs, as ranked by this system, are selected, provided they also demonstrate economic sensibility, such as being exposed to similar risk factors. This selection process is conducted monthly, utilizing the preceding 24 months of historical data.
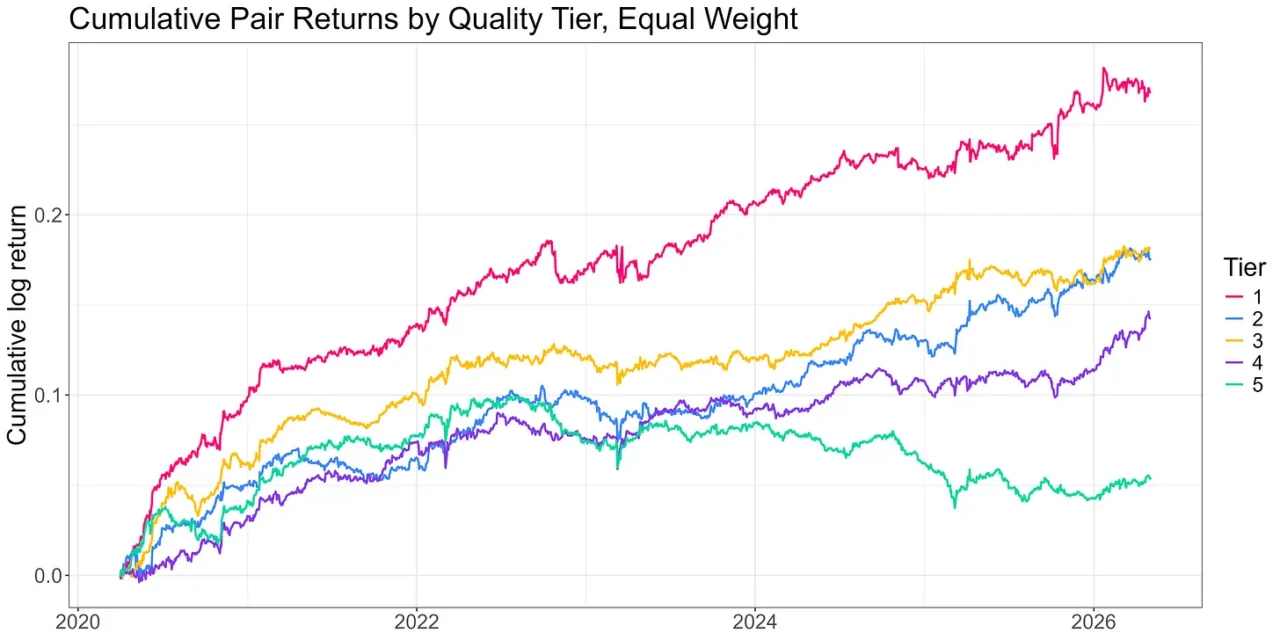
Within this top decile of pairs, a further stratification into five tiers is implemented. The chart below illustrates the before-cost returns generated by a simple pairs trading strategy applied to each tier, using equal weighting. This hypothetical scenario is presented solely to demonstrate the efficacy of the ranking system, as it does not represent a directly tradable strategy due to its cost-free assumption and equal weighting.
[Insert Chart: Pair Returns by Tier – Demonstrating performance differences across ranked tiers]
The ranking system demonstrably segregates pairs by quality. Tier 1 consistently leads in performance, while the middle tiers exhibit more variability but generally maintain strong performance. Tier 5, in contrast, significantly underperforms the others.
A quantitative analysis of risk-adjusted returns across these tiers reveals a notable spread. The Sharpe ratio between the top and bottom tiers shows a fourfold difference. While the middle tiers are less consistent, they still offer reasonably high risk-adjusted returns. However, a significant drawback of traditional pairs trading, as highlighted by the relatively low total returns in these tiers, is capital inefficiency. This is a problem that the subsequent stages of Triangulated Stat Arb aim to address.
The effectiveness of the pair-selection process cannot be overstated. It dwarfs any marginal gains that might be extracted from subsequent signal-generation work. The establishment of a high-quality pair universe is the fundamental prerequisite for success.
While the core ranking system is paramount, several subtle yet crucial operational details must be managed. These include liquidity filters, industry constraints, the frequency of universe refreshes, and robust procedures for handling delistings and acquisitions. These elements require careful consideration to maintain the integrity of the pair universe.
Ultimately, the most impactful work lies in the slow, meticulous upstream process of generating and maintaining a clean, ranked universe of pairs. While this requires more effort and deeper thought than automated cointegration testing, its effectiveness is empirically validated. Critically, the majority of the alpha captured throughout the rest of the trading pipeline is effectively predetermined by the quality of this initial pair selection.
Enhancing Efficiency: Triangulation and Consistency
Once a robust universe of high-quality pairs has been established, the strategy shifts from thinking in terms of individual pairs to considering individual tickers. This transition, facilitated by triangulation, addresses the primary limitations of traditional pairs trading: capital inefficiency and signal wastage, which often hamstring solo traders. The concept is thoroughly explored in "The Winter of our Pairs Trading Discontent."
The triangulation process involves examining each ticker that appears within the selected pair universe. For every pair a ticker participates in, it generates a per-ticker view. This view essentially represents a trade: being long the undervalued leg and short the overvalued leg, with a corresponding z-score indicating the degree of divergence from the spread’s rolling mean. By aggregating these per-ticker views across all pairs a specific ticker is part of, an overall "triangulated" signal for that ticker emerges. This aggregated signal is what is ultimately traded. More detailed information on this methodology is available in "The Metamorphosis."
When executed effectively, this network-based signal offers a substantial improvement over simple pairs trading. The logic is straightforward: if multiple independent pairs consistently indicate that a particular ticker is mispriced, the conviction behind that signal is significantly stronger than what any single pair could provide.
However, a naive implementation of this aggregation can diminish its effectiveness. Two common pitfalls include:
- Ignoring Interdependencies: Treating each pair’s signal independently without considering how they might be influenced by common underlying factors can lead to redundant or conflicting signals.
- Over-reliance on Individual Pair Strength: Placing undue emphasis on the z-score of a single pair without considering the broader consensus across multiple pairs can lead to trading on weaker signals.
A critical operational decision arises once the ticker-level signal is generated: how to best utilize it. The signal is most potent and informative at the extremes of its distribution. The mid-range of the signal typically contains more noise. By focusing trades on these extreme deviations rather than attempting to trade every ticker in the universe, the overall performance can be materially enhanced. This approach mirrors the practice in pairs trading, where trades are rarely initiated at a z-score of 0.5; instead, traders wait for more significant divergences.
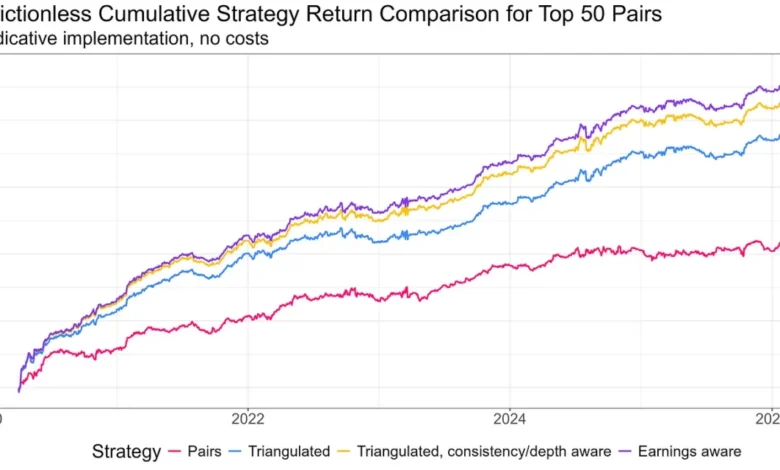
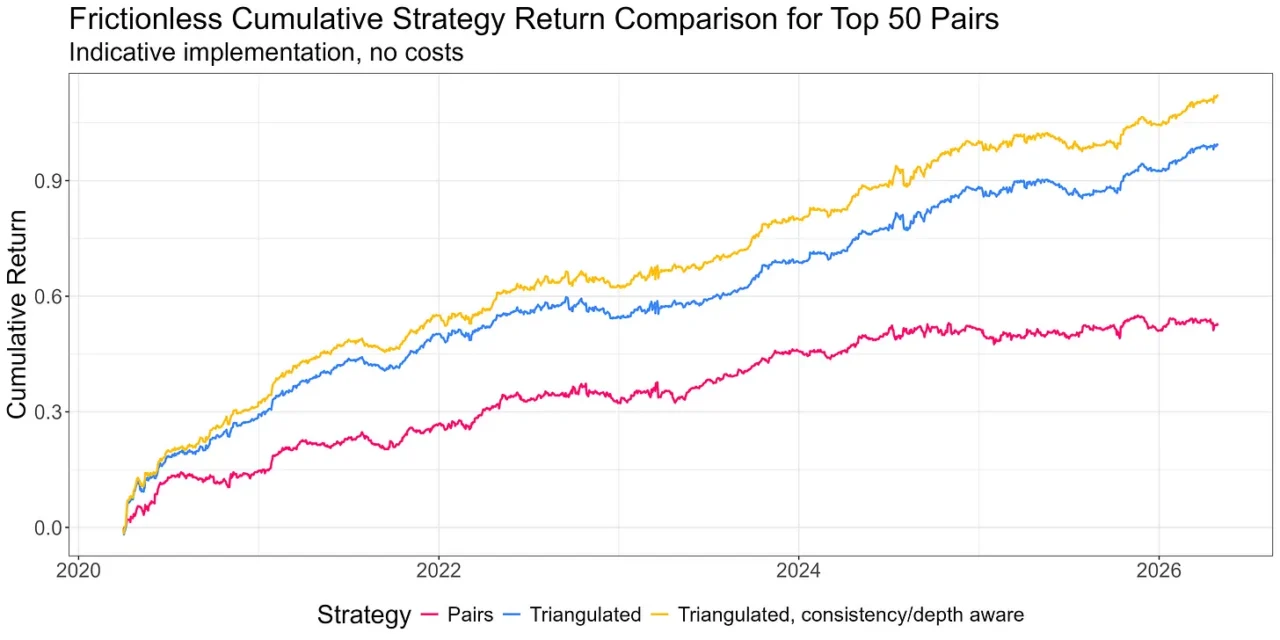
The following chart illustrates the before-cost returns of trading a portfolio of the top 50 pairs versus trading them as a triangulated long-short portfolio of mispriced legs, further refined by incorporating depth and consistency metrics.
[Insert Chart: Pairs Portfolio Consistency – Showing performance improvements from triangulation and consistency filtering]
The data clearly indicates that a portfolio constructed from mispriced legs derived through triangulation significantly outperforms a strategy solely trading pairs. Incorporating metrics for consistency and depth further refines performance, albeit with a smaller uplift. Crucially, this triangulated approach offers substantially greater capital efficiency for individual traders.
Navigating Market Nuances: Avoiding Premature Exits
The Triangulated Stat Arb signal effectively identifies potential mispricings, indicating when a spread has diverged and is likely to revert. However, it cannot inherently explain why a divergence has occurred. A spread suggesting a "short the expensive leg" signal appears identical whether the expensive leg has risen due to temporary, reversible technical flows or due to new, fundamental information that has permanently repriced the stock. The former presents a tradable "fade" opportunity, while the latter does not. Distinguishing between these scenarios constitutes the third crucial piece of the puzzle.
The natural avenues for investigation include analyzing volume, news, and event data. Each of these data types can offer clues as to whether a divergence is primarily technical and thus fadeable, or fundamental and therefore not to be faded.
The research into these areas has yielded some unexpected results. The exploration of volume data, specifically focusing on volume asymmetry – the intuition that forced selling on a cheap leg might differ from informed buying on an expensive leg – initially showed promise at the pair level. However, when integrated into the production strategy, its impact proved marginal. A significant portion of the information conveyed by volume data was already captured by the upstream pair-quality assessment. While aggregation from pairs to tickers did degrade the signal’s effectiveness, volume features are not currently part of the live strategy. It is worth noting that for a strategy focused solely on pairs trading, these volume features could still be a valuable addition.
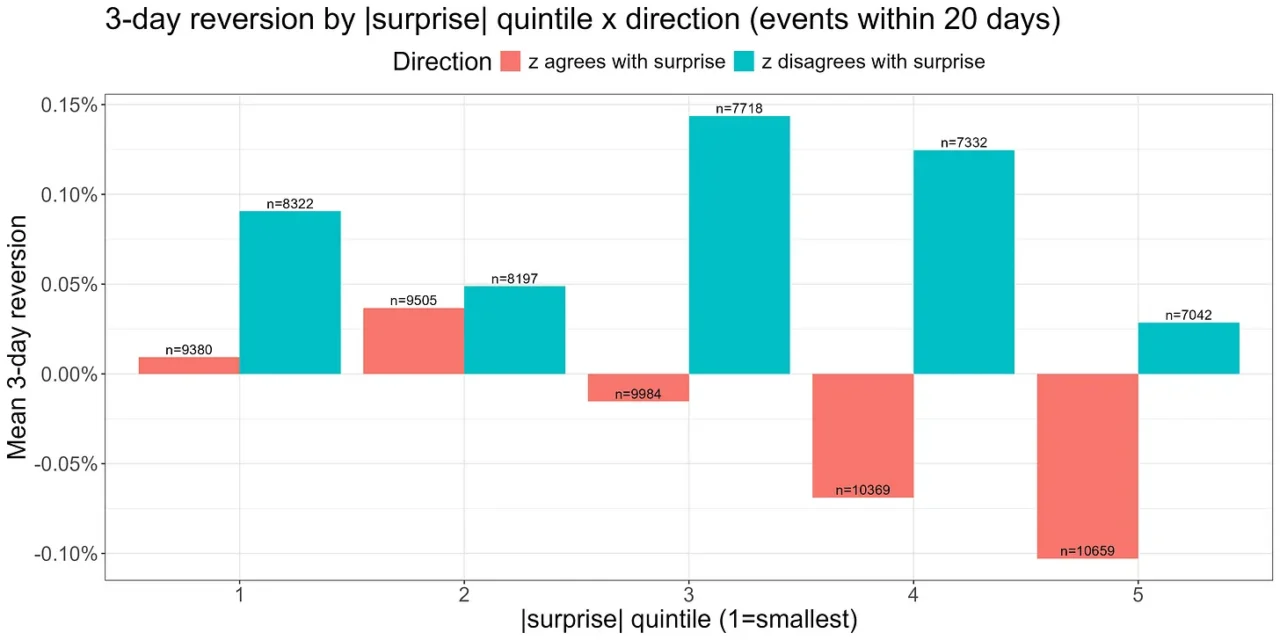
The most significant breakthrough in this third piece has come from an earnings filter. When an earnings surprise occurs within a spread’s formation period, the spread will naturally appear stretched in the direction of the surprise. However, the stock that has moved due to such an event has likely repriced based on substantive new information, rendering it unsuitable for fading. This mechanism is intuitively sound and supported by empirical data, providing a small yet meaningful enhancement to the live strategy.
The following chart illustrates the three-day reversion (defined as three-day forward returns signed by the negative of the z-score) in the presence of an earnings surprise during the z-score’s formation period. When the z-score is stretched in a direction consistent with the surprise (indicated by red bars), there is a notably reduced tendency for reversion. For substantial surprises, the reversion can actually become negative on average, indicating a continuation of the price movement, often referred to as the post-earnings drift effect.
[Insert Chart: Earnings Effect – Demonstrating reduced reversion and potential continuation after earnings surprises]
The introduction of an earnings filter into the trading decisions results in a demonstrable improvement in returns, as shown in the subsequent chart.
[Insert Chart: Earnings Filter Returns – Illustrating performance uplift with the earnings filter]
Broader news-based features represent the next frontier for research. The principle that proved effective for earnings surprises – that significant events driven by genuinely new information can undermine the mean-reversion thesis – is expected to generalize to other forms of news. Any surprise event that causes a substantial move in one leg of a spread based on novel information likely invalidates the expectation of short-term mean reversion. This area is currently under active investigation.
While the third piece of the methodology is undeniably important, the incremental gains observed have been smaller than initially anticipated. This is largely attributable to the substantial groundwork laid by the pair-quality assessment in the upstream stages. It is estimated that the pair selection process accounts for 80-90% of the strategy’s overall performance, a reality that becomes increasingly evident as subsequent refinements yield progressively smaller marginal returns.
Operationalizing the Strategy: Resources and Community
The methodology, as outlined, is brought to life through robust resourcing. In the Robot Wealth Pro (RW Pro) platform, an Application Programming Interface (API) provides end-of-day and intraday spread data, essential for live trading and historical research.
The upstream pipeline responsible for generating the monthly pair universe from thousands of candidate stocks is a significant undertaking. It involves substantial data ingestion, cleaning, and the computation of rankings across hundreds of thousands of potential pairs. The data and computational resources alone would far exceed the annual cost of an RW Pro subscription, not to mention the considerable time and expertise required to build and maintain such infrastructure. This foundational work has been completed and is made available to the community.
The data resources are designed for both trading and exploration. The RW Pro research environment hosts the complete historical datasets upon which the methodology was developed, allowing members to investigate any aspect of the data they choose. This empowers them to test their own hypotheses regarding pair quality, explore additional features for the third piece of the methodology, or experiment with alternative signal construction techniques.
A particularly valued component of the offering is an example implementation notebook. This notebook serves as a practical guide, demonstrating how the framework can be adapted to individual needs. Recognizing that there is no single "one size fits all" solution in trading, the notebook allows members to adjust various configuration knobs – including universe size, weighting schemes, no-trade buffers, signal thresholds, and leverage levels – to align with their specific account sizes, cost structures, risk tolerances, and operational capacities.
This flexibility is crucial. A full-time trader managing a $5 million portfolio operates under different constraints than a part-time trader managing $100,000 while balancing other professional and personal commitments. The RW Pro community comprises traders with diverse operational scales and approaches, all possessing a deep understanding of their strategies, the rationale behind them, and the inherent trade-offs involved. This fosters independence, equipping individuals with the knowledge and tools to navigate the markets successfully, akin to learning to captain their own vessel rather than simply being given a fish.
The development of this methodology was a collaborative effort, unfolding over six months within the RW Pro membership. The community actively participated, posing questions that refined the research and contributing their own findings when they identified overlooked insights. Some of these community contributions have been integrated into the live strategy, illustrating a reciprocal flow of knowledge and benefit.
Conclusion: A Hierarchical Approach to Alpha Generation
In summary, the Triangulated Statistical Arbitrage methodology, when properly resourced, presents a structured path to alpha generation for independent traders. The hierarchy of returns is evident: pair selection at the universe level provides the most substantial gains, accounting for the lion’s share of performance. Aggregation across pairs introduces a significant uplift, while depth- and consistency-aware filtering offers a further refinement. The earnings filter adds a smaller, yet valuable, increment. Volume analysis, while promising at the pair level, has not translated into significant gains within the triangulated framework, and news features remain an active area of research.
The core message is consistent: each successive stage of refinement yields diminishing marginal returns on the effort invested. Ultimately, the success of the entire endeavor hinges on the meticulous and thoughtful selection of pairs.
Triangulated Statistical Arbitrage transforms equity pairs trading into a viable strategy for solo operators. The accompanying infrastructure – the data API, research environment, example implementations, and the collaborative community – democratizes access to this sophisticated approach, making it achievable without requiring full-time engineering resources.
For those who have followed this series, the conceptual roadmap is now clear. For those seeking to witness this resourced version in action, the opportunity to explore further is readily available.