Feature Engineering for Modern Trading Systems: How Transforming Market Data Creates Uncorrelated Edge

The modern landscape of quantitative finance is defined by a paradox of ubiquity: retail and institutional traders alike possess near-instant access to the same foundational market data, the same standard technical indicators, and the same historical pricing feeds. High-speed servers and globalized networks have effectively democratized raw OHLCV (Open, High, Low, Close, Volume) data. Consequently, traditional strategies built entirely upon standard configurations of the Relative Strength Index (RSI), Moving Average Convergence Divergence (MACD), or simple moving averages frequently suffer from performance decay. When every market participant evaluates the same inputs through identical lenses, the resulting trading signals become crowded, eliminating the possibility of securing sustainable, uncorrelated alpha.
To overcome this structural hurdle, sophisticated quantitative developers and algorithmic funds have increasingly turned toward feature engineering. Long established as a cornerstone of advanced machine learning and data science, feature engineering involves the intentional transformation of raw datasets to improve the predictive capacity of algorithms and predictive models. In the context of systematic trading, this practice moves beyond observing what a market is doing at a single moment. Instead, it systematically interrogates how market dynamics evolve across time, transforming simple price observations into rich, contextualized indicators of market regimes.
The Evolution and Mechanics of Feature Engineering
At its core, feature engineering in finance is not a novel invention; it is a formalized iteration of a philosophy long championed by legendary quantitative minds. As Jim Simons, founder of the pioneering quantitative hedge fund Renaissance Technologies, famously observed when discussing signal construction, dividing volume by a multi-day price change uncovers structural market asymmetries that raw indicators routinely obscure. Simons was not referring to a proprietary technical indicator, but rather to the mathematical transformation of time-series data to extract hidden value.
When traders rely solely on raw inputs, they miss vital contextual nuances. For example, noting that the RSI has dipped below 30 provides a rudimentary oversold reading. However, transforming that raw data into a composite feature—such as determining that the RSI has remained below 30 for four of the past five trading sessions while the CBOE Volatility Index (VIX) trends upward—creates an entirely different informational profile. This distinction is critical because standard trading systems and machine learning algorithms are inherently literal; they struggle to infer unstated market conditions. A model is only as effective as the environment descriptors fed into it, making the quality of feature engineering directly proportional to the long-term success of the trading strategy.
The foundational building blocks of feature engineering require little more than basic arithmetic operations applied to historical time series. These foundational techniques include:
- Lagging Data: Applying a lag to price actions, indicator outputs, or external events often yields superior results compared to reacting to real-time signals. Because financial markets frequently require time to digest complex information, lagging a trading signal helps systems capture delayed, structured reactions rather than erratic, high-noise initial movements.
- Mathematical Operations: Comparing disparate data fields via basic arithmetic—such as calculating daily price range relative to a 20-day average range, or subtracting a 5-day mean from a current indicator value—uncovers mathematical asymmetries at virtually zero computational cost.
- Summing and Counting: Evaluating the cumulative behavior of an indicator over an extended window, or counting the exact frequency of an event (e.g., identifying whether a daily low has undercut the previous session’s low across multiple consecutive bars), establishes behavioral persistence rather than isolated price spikes.
- Averaging and Smoothing: Moving averages remain vital tools for mitigating single-bar market noise, ensuring that systematic execution engines remain stable during volatile sessions.
- Scaling and Standardizing: Because disparate datasets utilize vastly different numerical bounds—such as the NYSE Tick value ranging from -1000 to +1000 versus the RSI bounded between 0 and 100—normalization ensures that machine learning algorithms assign importance based on predictive value rather than raw numerical magnitude.
- Recency and Sequence Matching: Measuring how many bars have elapsed since a specific signal last fired, or evaluating strict multi-bar binary sequences (such as true-false-true-true patterns), allows quantitative systems to recognize distinct market regimes that single-value metrics fail to capture.
Advanced Feature Engineering Patterns for Market Regimes
Moving beyond basic transformations reveals complex structural patterns that institutional developers utilize to diagnose precise market environments. Rather than asking a binary question about whether a condition is currently true, advanced feature engineering deploys comprehensive structural queries.
Signal frequency serves as a primary regime indicator. By calculating the ratio of how often a signal fires relative to a specific lookback window (count divided by lookback periods), developers can instantly identify whether a setup is suffering from over-crowding or remaining uniquely fresh. Similarly, signal freshness compares long-window historical frequencies against short-window occurrences, lighting up dynamically when short-term activity surges past baseline levels—frequently acting as an early warning system for developing regime shifts before they fully manifest on a trading equity curve.
Signal contradiction represents another sophisticated operational pattern. By evaluating instances where a primary bullish setup executes while a secondary, traditionally confirming bearish signal remains silent, developers can successfully filter out overly obvious retail trades. If both signals fire simultaneously, the corresponding market move is frequently already priced in; if only one fires, early positioning advantages can be secured.
Additional advanced methodologies include the integration of delay-plus-condition structures, which wait for market acceptance over a multi-bar horizon before committing capital, and sweetspot bounding, which identifies optimal operational frequencies to ensure a regime is neither under-established nor entirely exhausted.
Technological Integration: No-Code Platforms and Automated Generation
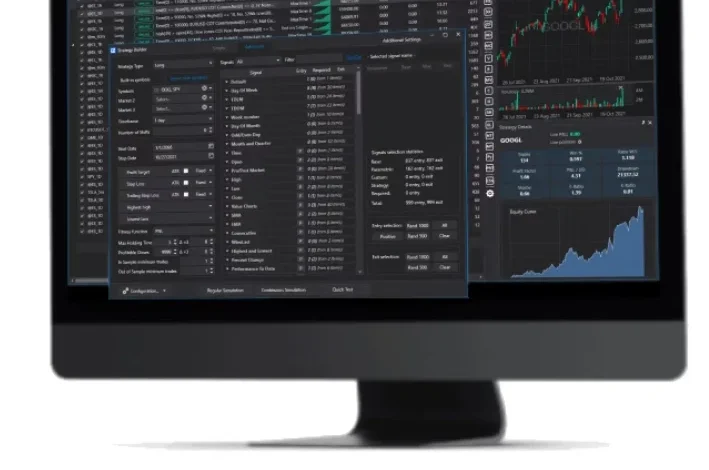
Historically, executing advanced feature engineering demanded extensive programming expertise in languages such as Python, C++, or C#, alongside dedicated database management infrastructure. However, the rise of specialized quantitative development platforms, such as Build Alpha, has fundamentally altered this paradigm by introducing intuitive, graphical no-code environments.
Modern algorithmic platforms now integrate extensive built-in signal libraries spanning thousands of indicators across numerous categories, including price action, volume dynamics, macroeconomic yields, sentiment metrics, and intermarket spreads. Within these ecosystems, custom signal editors allow quantitative developers to construct complex nested features—such as evaluating rolling percentages of multi-day lower lows—using point-and-click interfaces. For instance, creating a multi-layered rule to monitor instances where at least two of the prior three days experienced lower lows across a 50-day rolling window can be compiled instantly without writing raw code. Historically, similar quantitative features successfully acted as structural bear-market warnings heading into major macroeconomic dislocations like those observed in 2008 and 2022.
Furthermore, contemporary algorithmic software has embraced automated feature engineering through machine-generated rules. By enabling automated generation parameters, quantitative systems can autonomously construct hundreds of unique feature variations—including pairwise correlations, weighted sums, sequence matches, and sweetspot bands—and feed them directly into genetic algorithms for strategy discovery.
This rapid-prototyping capability is further augmented by the integration of Large Language Models (LLMs) acting as orchestration agents. Platforms now allow advanced AI models, such as Claude or GPT, to author custom entry and exit signals mid-session based on real-time AutoTune simulation outputs. When an LLM determines that a novel volatility-adjusted breadth metric or sentiment-normalized momentum feature is required for a shifting market regime, it writes the underlying logic, which is then passed to the simulation engine.
The Critical Role of Rigorous Validation
Despite the immense creative power offered by manual, automated, and LLM-driven feature engineering, quantitative experts issue a uniform caveat: generating a high volume of novel features does not automatically equate to superior strategy performance. The fundamental risk inherent in expansive feature generation is the statistical trap of curve-fitting and false-positive discovery. When thousands of unique transformations are tested against historical data, certain random configurations will inevitably pass backtesting hurdles purely by chance.
Consequently, generation must always be paired with uncompromising empirical validation. Industry-standard testing pipelines—including out-of-sample walk-forward optimization, noise testing, and randomization benchmarking—remain mandatory safeguards. While modern technology has made feature generation inexpensive and rapid, statistical validation remains the definitive arbiter of real-world trading viability.
Ultimately, feature engineering represents the enduring frontier where human creativity and systematic rigor intersect within quantitative finance. By moving beyond conventional indicator configurations and asking nuanced questions regarding signal frequency, sequence, recency, and structural contradiction, developers can extract unique, uncorrelated insights from familiar market data. As automated tools and artificial intelligence continue to lower the barriers to entry for advanced data transformation, the strategic edge in systematic trading will increasingly belong to those who design the most intelligent questions, rather than simply consuming the most visible data.