The 2-year and 3-year yields indicate that the 10-year yield could go way higher over the next few months.


The bond market is currently grappling with a significant shift in interest rate expectations, as shorter-dated Treasury yields experience a rapid ascent that threatens to break the 5% resistance level for the 10-year benchmark. Following the Federal Reserve’s latest hawkish pivot, investors are recalibrating their portfolios to account for a sustained higher-for-longer interest rate environment. This market behavior suggests that the era of artificially suppressed yields, which dominated the post-2008 financial landscape, is continuing to unwind in favor of a return to historical market-driven interest rate discovery.
A Rapid Ascent in Short-Term Yields
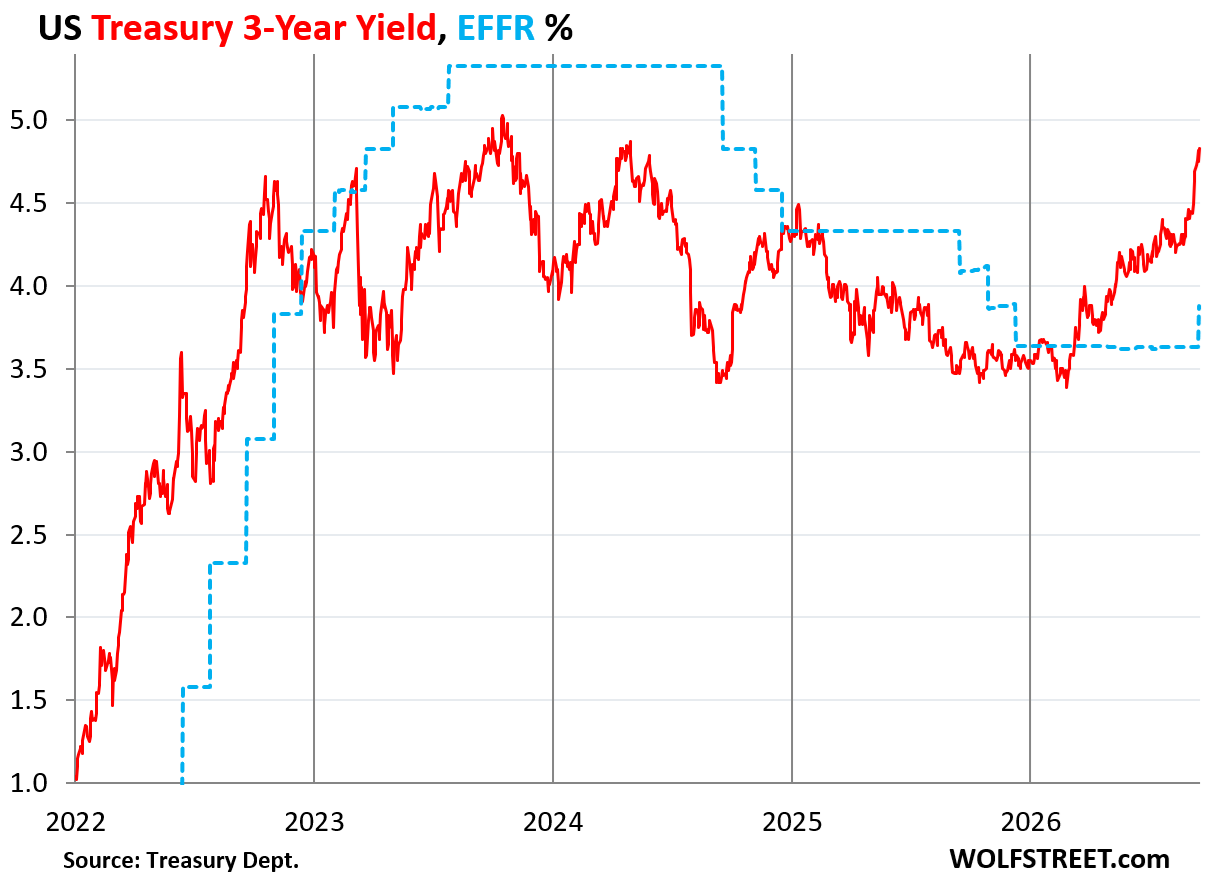
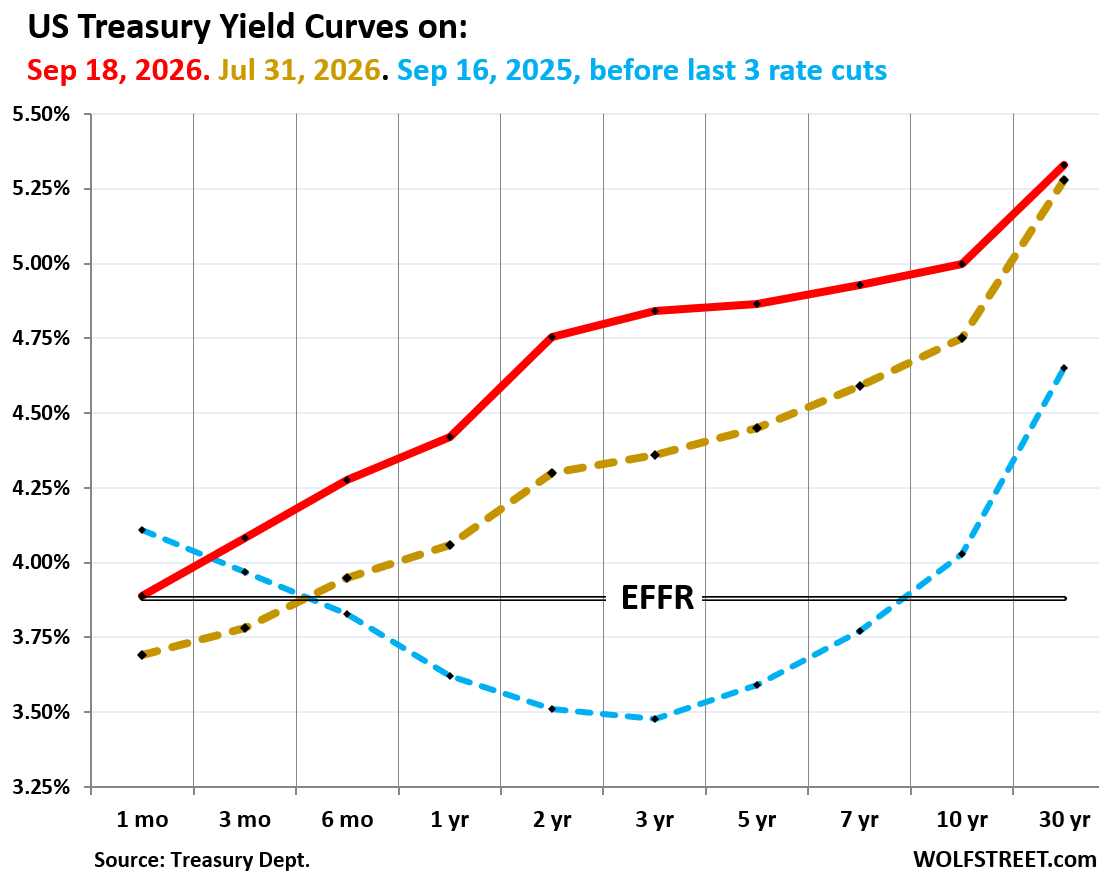
The 3-year Treasury note has become the focal point of market volatility, spiking by 14 basis points in the week following the Federal Reserve’s most recent policy meeting. Since the late-August Jackson Hole address by policymaker Kevin Warsh—which explicitly characterized current financial conditions as insufficiently restrictive—the 3-year yield has surged by 56 basis points. This move is part of a broader, sustained trend that has seen the 3-year yield climb 144 basis points since the end of February, closing the week at 4.86%.
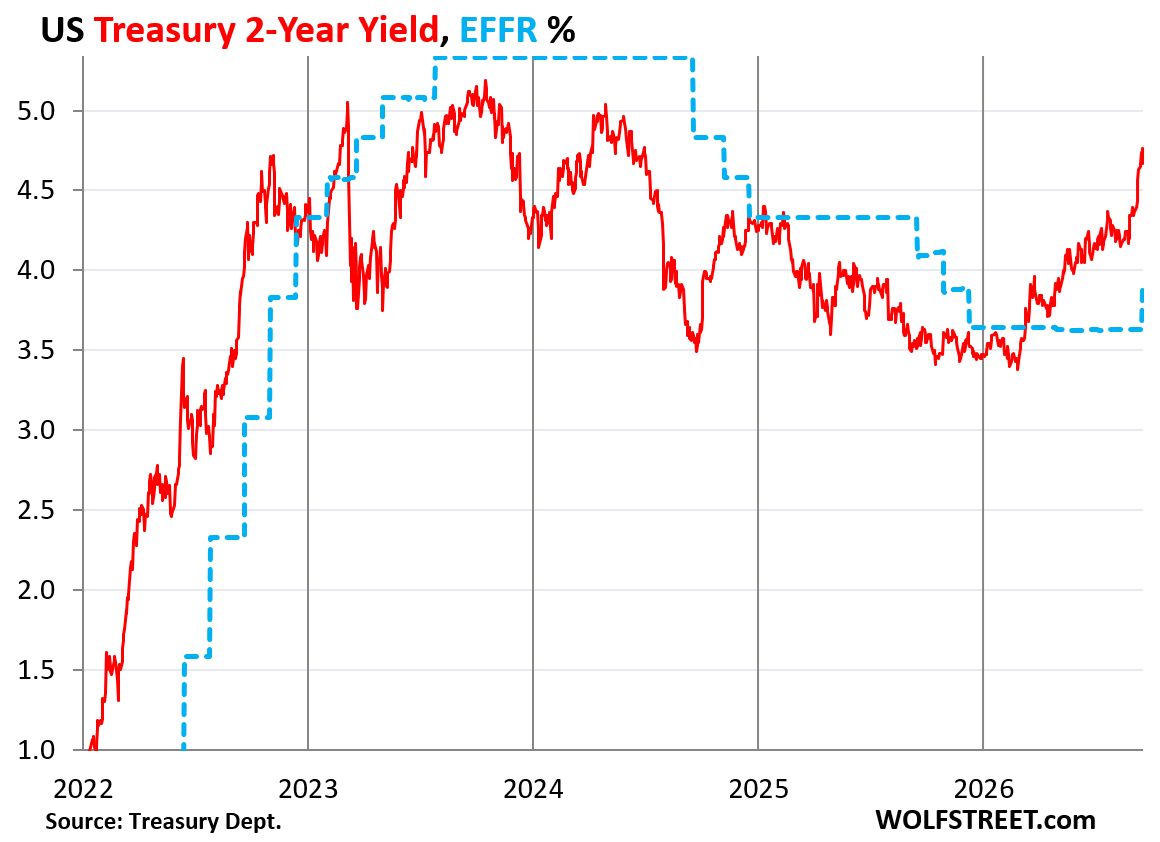
To put this in perspective, the 4.86% level is the highest the 3-year yield has reached since April 2024. The significance of this figure is underscored by the fact that it occurred months prior to the commencement of the Fed’s initial rate-cutting cycle. Similarly, the 2-year Treasury yield—often the most sensitive instrument to shifts in Federal Reserve policy—has risen 134 basis points since February, closing at 4.76%. These movements suggest that market participants are no longer betting on a quick return to dovish policy, but are instead pricing in a series of additional rate hikes.
Dissecting the Yield Curve and Market Sentiment
The spread between these short-term notes and the 10-year Treasury yield has narrowed to a degree that analysts consider historically anomalous. The 3-year yield is currently hovering just 15 basis points below the 10-year, while the 2-year yield sits only 25 basis points below it. In a normalized economic environment characterized by healthy growth and manageable inflation, the spread between the 2-year and 10-year yields typically ranges between 100 and 250 basis points.
The compression of this spread, commonly referred to as a "flattening" of the curve, suggests that the market is expressing a high degree of confidence in near-term monetary tightening. By trading at 95 basis points above the Effective Federal Funds Rate (EFFR), the 3-year Treasury indicates that investors are discounting the possibility of multiple future hikes. While buyers often flock to shorter-term maturities when yields approach the 5% threshold, the expected surge in demand has been notably absent, allowing yields to continue their upward trajectory.
The 10-Year Treasury’s Resistance at 5%
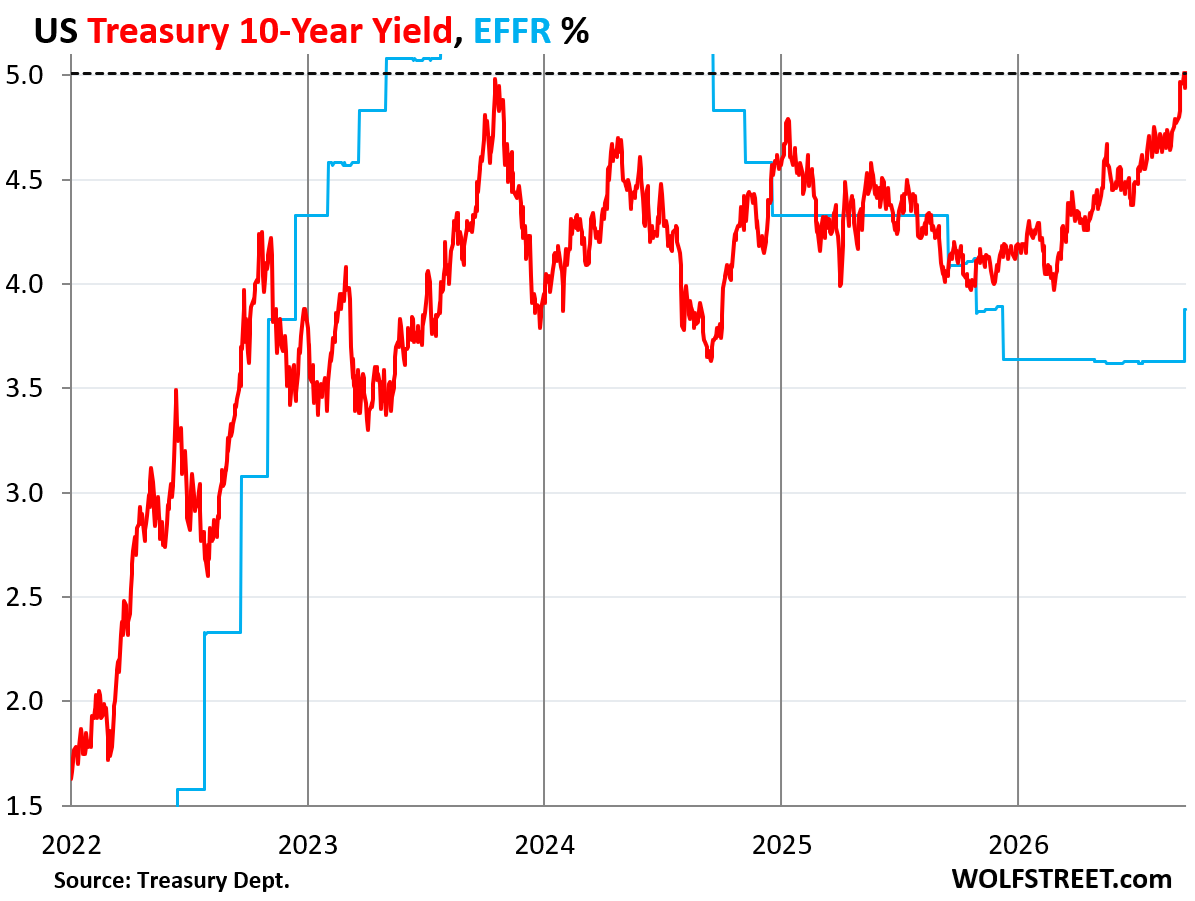
The 10-year Treasury yield has effectively hit a psychological and technical ceiling at 5%. Despite several attempts to breach this level, the yield has remained stuck, closing the week at 5.01%. This 5% mark is widely viewed as a "magic line" by market participants. In previous instances, such as the intraday peak on October 23, 2023, a breach of this level triggered an immediate and substantial influx of buying, causing yields to retreat rapidly.
This time, however, the market dynamic has shifted. While there remains enough buying pressure to prevent a runaway breakout above 5%, the lack of a significant, sustained retreat indicates that the "floodgates" of demand are no longer opening as they once did. The current environment is defined by a standoff: sellers are pushing for higher yields in response to persistent inflation concerns and deficit spending, while buyers are anchored to the 5% psychological threshold.

Historical Context: The End of Financial Repression
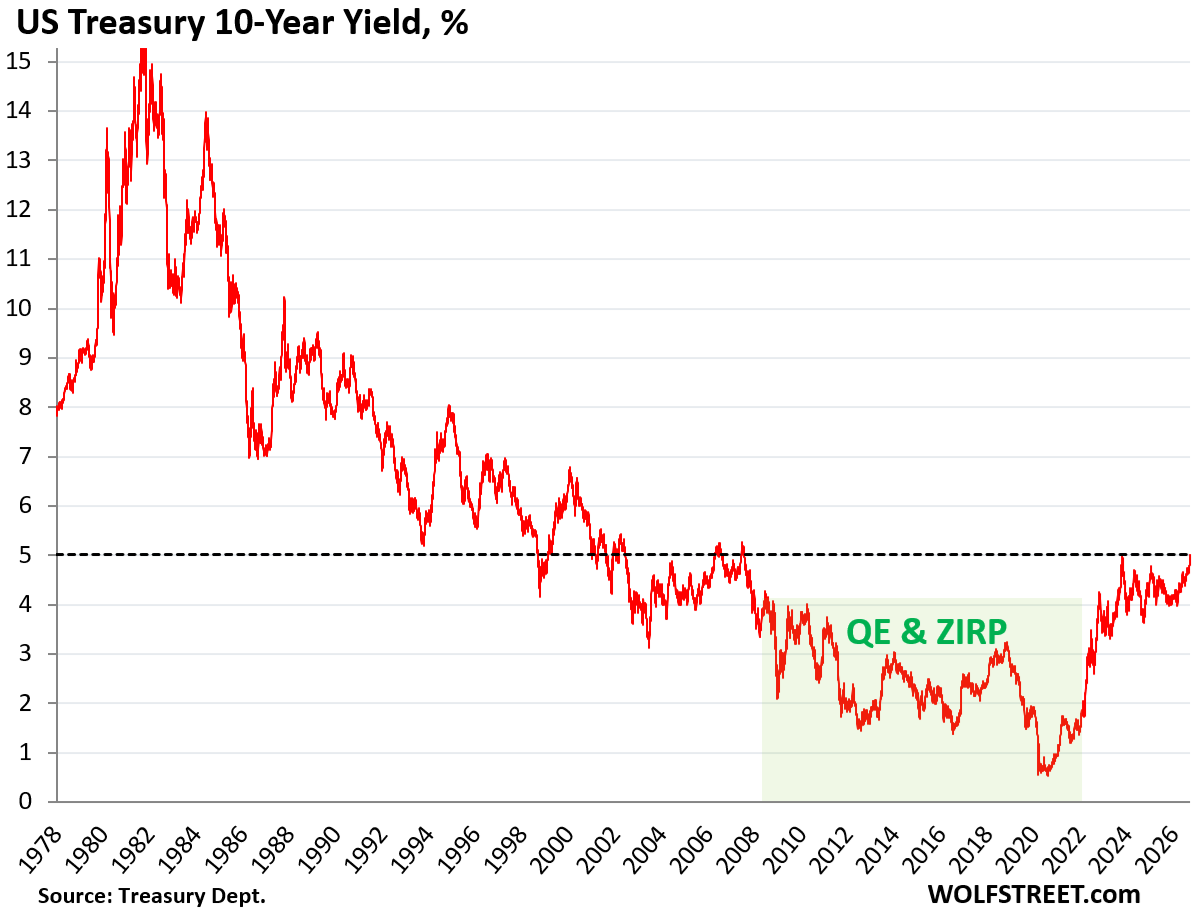
The current yield environment represents a profound departure from the period of "financial repression" that characterized the years between 2008 and 2022. During this era, the Federal Reserve utilized massive Quantitative Easing (QE) programs and Zero Interest Rate Policy (ZIRP) to artificially depress long-term yields. This policy was intended to stimulate investment, but it also contributed to unprecedented asset price inflation and a subsequent housing affordability crisis.
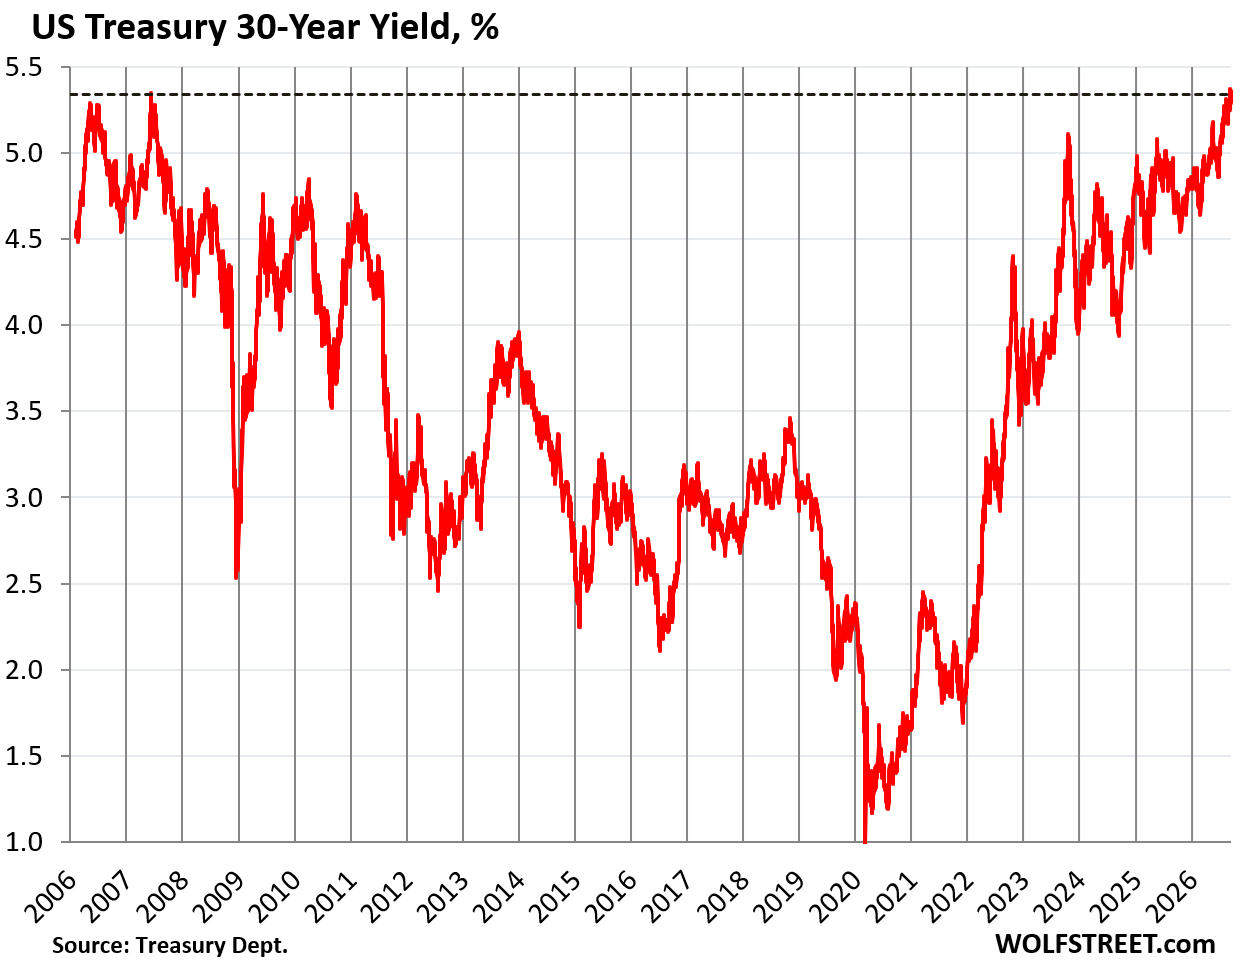
The market’s current "normalization" process—a term increasingly used by analysts following the Fed’s shift toward a less interventionist stance—marks a return to price discovery. Critics of the previous regime, including figures like Kevin Warsh, have long argued that suppressed yields distorted capital allocation. The current rise in 30-year Treasury yields, which closed at 5.34%, confirms that the bond market is reasserting itself after more than a decade of being anchored by central bank intervention.
Implications for the Broader Economy
The movement in the yield curve carries significant implications for the broader economy, particularly regarding corporate borrowing costs, mortgage rates, and government fiscal policy. As yields rise, the cost of servicing the national debt increases, placing further pressure on the federal budget. Furthermore, as the "middle" of the yield curve (2-year to 5-year maturities) continues to bulge, it suggests that the market is preparing for a future where interest rates remain elevated for a protracted period.
Economic data points, including the trajectory of inflation and labor market health, will dictate whether the 10-year yield eventually shatters the 5% resistance level. Should it break through, it would likely signal that the market has abandoned all hope of a "soft landing" and is instead preparing for a sustained period of higher interest rates necessitated by stubborn inflation.
Analytical Outlook
The current "bulge" in the yield curve—a red line on recent market charts—indicates a significant concentration of market sentiment between the 2-year and 10-year maturities. This suggests that the bond market is signaling a potential for the 10-year yield to continue its climb, even as long-term buyers attempt to hold the line at 5%.
The divergence between the aggressive rise in short-term yields and the relative stability of the 10-year note creates a fragile equilibrium. If the 3-year and 2-year yields continue to rise, the pressure on the 10-year Treasury will likely become insurmountable, forcing it higher to maintain a logical relationship within the yield curve. For investors, this environment necessitates a careful assessment of duration risk, as the historical precedent of 5% yields being "high" is rapidly becoming a relic of the era of financial repression.
Ultimately, the bond market is reflecting a fundamental shift in the macro environment. Whether this transition leads to a stable, higher-interest-rate equilibrium or further volatility depends on the Fed’s willingness to allow market forces to dictate the price of money. With inflation still a primary concern and deficit levels reaching new heights, the upward pressure on yields appears to be a structural, rather than cyclical, development. As the market enters the final quarter of the year, the 5% threshold on the 10-year Treasury remains the most critical indicator to watch, serving as the frontline in the battle between long-term institutional buyers and a market increasingly convinced that rates have yet to reach their peak.