Financial markets have spent recent weeks navigating a distinct divergence between major U.S. equity indexes, capturing the attention of institutional investors, retail traders, and macroeconomic analysts alike. The 30-stock Dow Jones Industrial Average has logged three consecutive weeks of losses, sliding roughly 3.5% from its late-August close. Conversely, the technology-heavy Nasdaq 100 has managed to edge slightly higher over the exact same timeframe. This stark performance gap has ignited a vigorous debate across Wall Street: Is this narrow divergence an ominous precursor to a broader market downturn, or is it merely a textbook sector rotation driven by shifting monetary policy?

To understand the mechanics behind this split, market observers must look closely at the macroeconomic triggers, index weightings, and seasonal forces currently shaping Wall Street. Rather than signaling an impending crash, a closer examination reveals a calculated reallocation of capital as institutional investors respond to a more restrictive Federal Reserve and soaring benchmark yields.
The Catalyst: Federal Reserve Policy and Yield Pressures
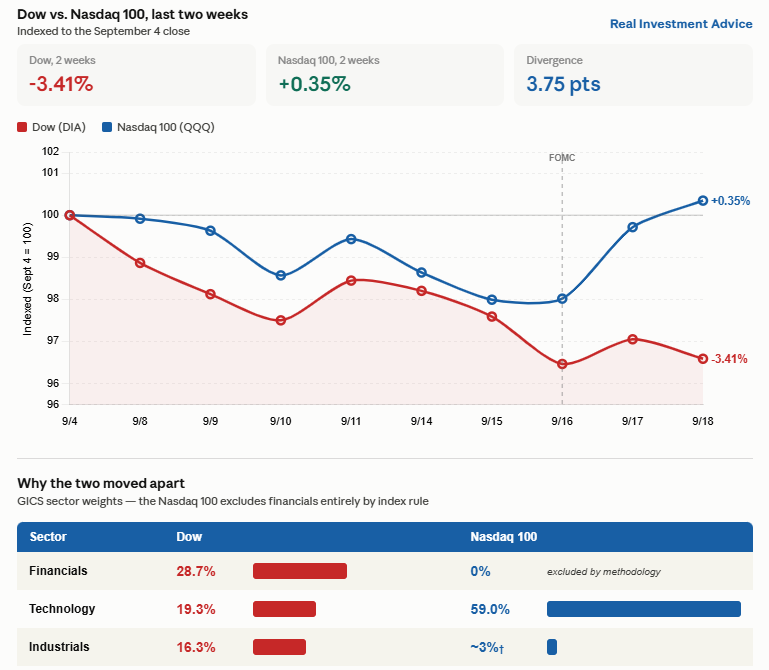
For much of the autumn, the Dow and the Nasdaq traded in relative tandem, sharing similar trajectories through the summer months. However, the turning point materialized immediately following the Federal Reserve’s policy meeting on September 16. During this pivotal gathering, central bank officials signaled a firmly restrictive stance, pushing borrowing costs higher and driving the benchmark 10-year Treasury yield to levels not witnessed since 2007.
Because the Federal Reserve opted to maintain its hawkish posture to combat persistent economic pressures, the reaction across individual market sectors was swift and predictable. Economically sensitive sectors and interest-rate-sensitive industries absorbed the immediate damage. Over a three-week window, the cyclically driven industrials sector tumbled 4.2%, while financial stocks—uniquely vulnerable to rising interest rates and a flattening yield curve—retreated 3.9%.
Conversely, the technology sector defied the broader macroeconomic headwinds, climbing roughly 2.1%. Analysts point out that mega-cap technology firms and artificial intelligence infrastructure providers are uniquely insulated from minor shifts in short-term policy rates. Because massive capital expenditures and AI deployment contracts are typically locked in years in advance, these tech titans remain largely indifferent to quarter-point fluctuations in the federal funds rate.
Index Construction: Why the Dow and Nasdaq Diverge

The stark performance discrepancy between the two benchmarks is largely a byproduct of their underlying mathematical construction. The Dow Jones Industrial Average is a price-weighted index heavily skewed toward traditional, cyclical enterprises. Financial institutions account for more than 25% of the Dow’s total weighting, while industrial companies comprise approximately 16%.
The Nasdaq 100 presents an entirely different financial ecosystem. The index holds virtually zero exposure to traditional financial stocks and allocates a meager 3% to industrials. Instead, technology shares dictate nearly 60% of the Nasdaq’s movement. Consequently, when rising bond yields penalize financials and cyclical manufacturing stocks, the price-weighted Dow suffers disproportionately. When those same yields fail to dent the forward-looking growth narratives of cash-rich software and hardware giants, the Nasdaq effortlessly shrugs off the broader market’s malaise.
Market Structure and September Seasonality
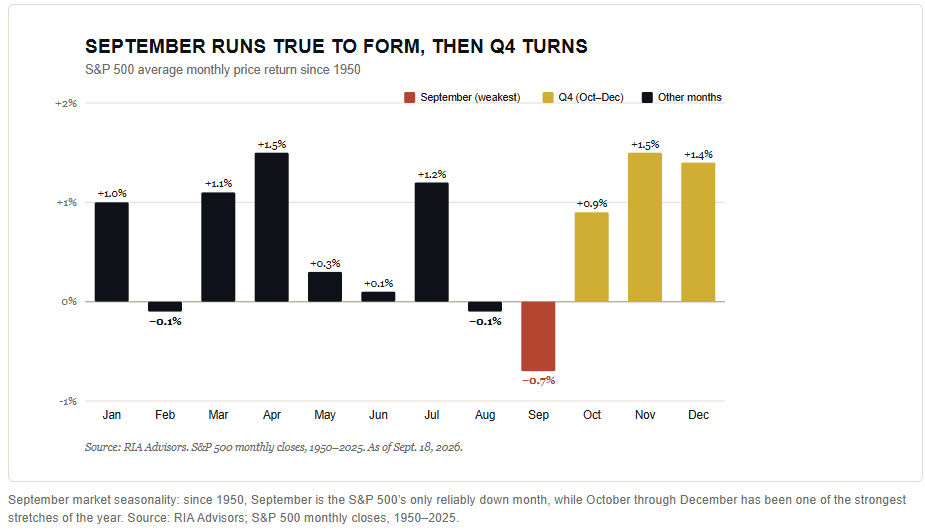
Beyond interest rate dynamics, the current market environment is heavily influenced by calendar anomalies and institutional trading flows. Looking at historical trading patterns, September has long held a formidable reputation among quantitative analysts. Since 1950, September stands out as the only calendar month with a reliably negative average return, historically hovering near a loss of 0.7%, with the back half of the month marking the weakest two-week stretch of the entire year.
Institutional trading desks, such as those at Citadel, have noted that corporate stock buybacks have entered a mandatory blackout period. At the start of the month, corporate repurchases accounted for roughly 10% of overall index weight, but that figure surged toward 61% by the close of September. Simultaneously, approximately $7 trillion in options expired during the recent triple-witching event, coinciding with end-of-quarter portfolio rebalancing that prompted pension funds and institutional managers to reduce equity exposure.
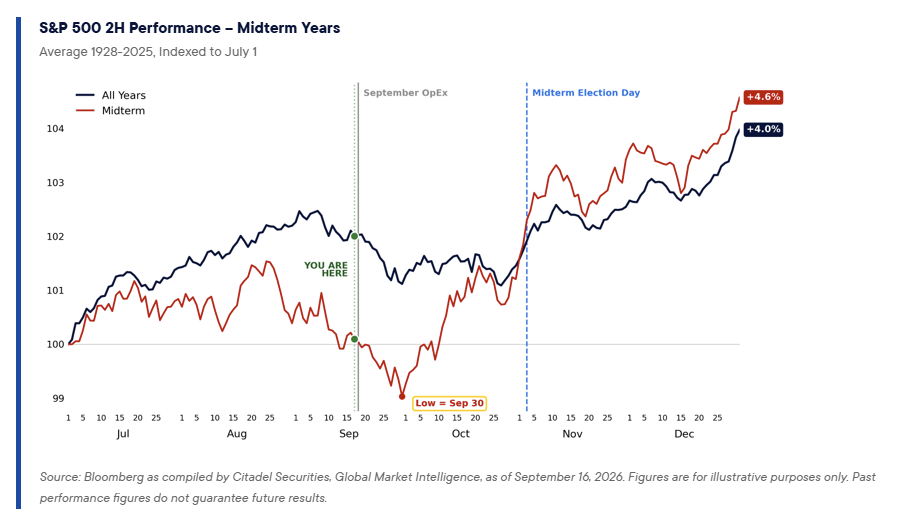
Furthermore, the overlay of a midterm election year introduces unique behavioral patterns to the tape. Historical data compiled across midterm cycles since 1928 indicates that a slide into quarter-end typically finds a durable market bottom right around September 30. From that seasonal low point, historical precedence shows the S&P 500 often initiates a recovery, climbing an average of 5.6% into year-end and accelerating past Election Day. Notably, the index has finished higher on a 12-month forward basis following every single midterm election since 1950.
Earnings Revisions and the Long-Term Macro Trend
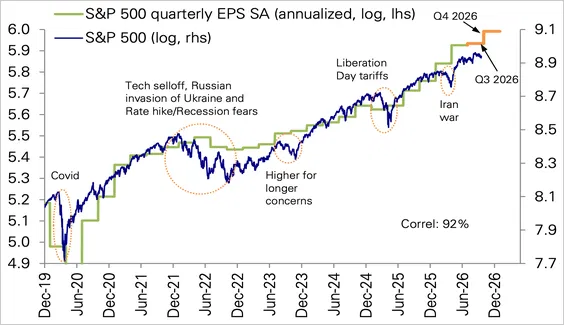
Amid the seasonal turbulence and interest rate anxiety, corporate fundamentals continue to offer a powerful anchor for the equity market. Wall Street analysts have spent the entirety of the year upwardly revising corporate earnings estimates. While the consensus at the start of the year anticipated S&P 500 earnings growth of roughly 15%, stellar second-quarter corporate reports forced analysts to ratchet those expectations up to nearly 24%. Estimates for subsequent years have steadily drifted higher in tandem.

This persistent strength in corporate profitability has kept the broader market orderly. The S&P 500 recently reclaimed its 50-day moving average, hovering comfortably above its rising 200-day moving average. Market strategists emphasize that the ongoing pullback is narrow and rotational rather than disorderly, noting that approximately nine of eleven major sectors have experienced downward pressure over the course of the month, leaving roughly 31% of index constituents trading above their respective 50-day moving averages.
However, some seasoned analysts urge caution regarding the sheer velocity of these positive revisions. Consensus forward earnings projections currently sit nearly 50% above their long-term historical growth trend. Financial historians note that valuation gaps of this magnitude rarely appear at random intervals within a business cycle; rather, they frequently materialize near cyclical peaks, suggesting that investors must remain vigilant regarding potential earnings mean reversion as macroeconomic conditions evolve.

Broader Implications and Portfolio Strategy
As market participants evaluate the remainder of the fourth quarter, professional wealth managers and advisory firms are advising a measured approach. Rather than aggressively chasing short-term market bounces, many institutional allocators recommend prioritizing high-quality assets and value-oriented equities over high-beta speculative plays.

Additionally, parked cash reserves continuing to yield stable returns provide a comfortable buffer for investors looking to construct shopping lists ahead of expected month-end weakness. Capital preservation remains the overarching priority for conservative portfolios.
Looking forward, the trajectory of underperforming sectors—such as utilities, consumer discretionary, and real estate—will likely depend heavily on the stabilization of long-term bond yields and global commodity markets. If the 10-year Treasury yield manages to establish a ceiling below 5% and begins a gradual descent, beaten-down sectors could find the catalyst necessary to participate in a broader market recovery. Until then, the ongoing divergence between the Dow and the Nasdaq serves as a vivid reminder that beneath the surface headline figures, a complex and calculated reallocation of global capital is actively reshaping the financial landscape.
Related posts: