LLM-Powered Trading Strategy Reimagines Risk Management for Enhanced Stability

Many quantitative trading strategies that leverage Large Language Models (LLMs) falter due to the inherent difficulty of accurately predicting future market returns. A foundational insight, highlighted by E.P. Chan in 2024, posits that reliably forecasting tomorrow’s market movements is a task beyond the current capabilities of any predictive model, whether statistical, machine-learned, or language-based. Recognizing this limitation, a novel trading strategy has been developed, shifting the LLM’s role from a market direction forecaster to a sophisticated risk manager, dictating investment allocation rather than market trajectory. This innovative approach aims to enhance trading stability by focusing on calibrated exposure management and robust risk mitigation.
The strategy operates on a monthly walk-forward loop, ensuring that the LLM’s decision-making policy is continuously refreshed with the latest market data. This iterative process allows for the dynamic re-optimization of guardrail thresholds, adapting to evolving market conditions. At its core, the system incorporates hard guardrails—volatility stops, drawdown stops, and a forced re-entry mechanism—designed to act as a critical safety net, preventing catastrophic losses even when the LLM’s assessments prove insufficient. All performance evaluations have been rigorously conducted out-of-sample (OOS) from January 2023 onward, providing a transparent and verifiable assessment of the strategy’s efficacy. Further research is presented as a pathway for continuous improvement.
Prerequisites for Understanding the Strategy
To fully grasp the intricacies of this LLM-driven trading strategy, a foundational understanding of several key concepts is beneficial. On the technical front, proficiency in Python, particularly with pandas DataFrames and NumPy arrays for time-series manipulation, alongside experience in making API calls using the requests library, is essential. Resources such as "Python for Trading: A Step-By-Step Guide" can serve as valuable refreshers.
Furthermore, a solid grasp of backtesting methodologies, including the principles of out-of-sample evaluation and the calculation of performance metrics like Sharpe ratio, Sortino ratio, Calmar ratio, and maximum drawdown, is assumed. The guide "What Is Backtesting & How to Backtest a Trading Strategy Using Python" offers a comprehensive overview of these concepts.
Strategically, the approach intersects three core ideas: market regimes, LLM-assisted decision-making, and risk-aware position sizing. Understanding how to discretize continuous price signals into labeled market states, as detailed in "Market Regime using Hidden Markov Model," provides crucial context. The walk-forward loop, a central component of the strategy, is elucidated in "Walk-Forward Optimization (WFO): A Framework for More Reliable Backtesting." For the position-sizing layer, concepts such as volatility targeting and the Kelly criterion, as explored in "Position Sizing Strategies and Techniques in Trading," are foundational. Finally, prior familiarity with extending LLM workflows, specifically passing compact numeric summaries and parsing strict JSON policy tables, is recommended, as detailed in "AI Forex Backtesting with LLM Regime Labels: DeepSeek vs KMeans in Python."
Introduction: Reframing the LLM’s Role in Trading
A prevalent reason for the failure of LLM-powered trading strategies lies in the fundamental nature of the questions they are posed. Traditionally, strategies might ask an LLM: "Will the stock go up or down tomorrow?" This is a direct prediction task, a domain where no model, regardless of its sophistication, has demonstrated a consistent edge for highly liquid large-cap stocks like Apple (AAPL).
The critical shift proposed by this strategy redefines the LLM’s function from a directional predictor to a risk assessor. Instead of forecasting price movements, the LLM is tasked with evaluating risk based on historical market behavior within specific states. The rephrased question becomes: "Given my understanding of how this stock has performed in each market state over the past three years, does today’s state resemble one where I should be fully invested, or should I reduce my exposure?"
This strategy employs DeepSeek, an LLM, to analyze a table of historical statistics for each identified market state. These statistics include mean return, standard deviation, and a Sharpe-like score. Based on this analysis, DeepSeek generates a policy table that dictates the appropriate investment allocation for each state. The output is constrained to a range between 50% and 100% long exposure, with no short positions or leverage, focusing solely on calibrated, regime-aware exposure.
Layered on top of the LLM’s policy are robust hard guardrails. These act as an independent safety mechanism. If realized volatility experiences a significant spike, confirmed by acceleration metrics, or if the strategy’s equity drawdown exceeds a predetermined threshold, also with trend-break confirmation, the system automatically de-risks. A built-in re-entry mechanism ensures that the strategy is not permanently sidelined after a de-risking event.
By the conclusion of this detailed exploration, readers will gain a comprehensive understanding of every component of the implementation, from the initial feature engineering and LLM prompt design to the sophisticated walk-forward backtesting loop.
Step 1: The Control Panel: Centralized Settings Management
Effective backtesting and strategy development begin with a meticulously organized "control panel"—a single, editable section that governs all experimental parameters. This approach ensures consistency and facilitates rapid iteration. The strategy’s control panel is structured into three distinct layers of settings: data parameters, cost assumptions, and the exposure mapping that translates the LLM’s output into concrete position sizes.
The core of the exposure mapping lies in three defined constants: LONG_FULL_EXP, LONG_HALF_EXP, and FLAT_EXP. These constants serve as the crucial bridge between the LLM’s qualitative risk assessments and the portfolio’s tangible risk exposure. Notably, FLAT_EXP is set at 0.5, not 0.0. This deliberate choice signifies that a cautious signal from the LLM translates to a reduction in exposure, rather than a complete exit from the market. This strategy maintains a degree of market participation even during periods of uncertainty, preserving the potential to benefit from positive market drift.
The Rationale Behind FLAT_EXP = 0.5: In strongly trending markets, such as the observed bull run in AAPL from 2023 to 2026, completely exiting the market on every cautious signal could have resulted in a significant reduction in Compound Annual Growth Rate (CAGR), potentially costing around 10 percentage points. By implementing a 0.5 floor, the strategy ensures continued participation in market upside while still effectively communicating the LLM’s risk-off sentiment.
Furthermore, the MAX_FLAT_DAYS and REENTRY_SIZE parameters are crucial for addressing a subtle yet potentially devastating issue known as the "guardrail deadlock." This problem, which can silently erode strategy performance, will be explored in detail in Step 7, which covers the guardrail logic.
Step 2: Data Acquisition and Integrity
In the realm of algorithmic trading, the adage "garbage in, garbage out" holds particularly true. The success of any strategy is fundamentally dependent on the quality and accuracy of the data used. For stocks with a history of splits, such as AAPL, which has undergone multiple splits since 1990, obtaining appropriately adjusted historical data is paramount.
The auto_adjust=True flag is non-negotiable when downloading price data. Without this setting, historical price data would not account for stock splits, leading to artificially inflated return spikes on split dates. These anomalies would severely corrupt all subsequent downstream calculations, including rolling volatility, z-scores, and trend scores, rendering the analysis unreliable. To mitigate this, a rigorous sanity check is implemented immediately after the feature engineering process. This defensive check, requiring only a couple of lines of code, has proven instrumental in preventing backtests from yielding entirely erroneous results.
Step 3: Feature Engineering: Capturing Market Sentiment
Raw price data provides a historical record of where the market has been, but it is through feature engineering that we gain insights into the market’s "mood" or state. This strategy computes seven distinct signals derived from Open, High, Close, and Volume (OHLCV) data. The overarching objective of these features is to encapsulate the current market state in a compact and interpretable manner.
Traders and developers are encouraged to explore and integrate additional features and technical indicators, such as those available through the widely used ta-lib library. An installation guide for ta-lib in Python is readily available.
Step 4: Discretizing Market States for LLM Comprehension
Working with continuous features can be computationally challenging and leads to an overwhelming number of potential combinations. To address this, the strategy discretizes each signal into two or three distinct categories. These binned categories are then combined to form a single, descriptive state string. This process results in a manageable set of 12 distinct market states. This limited number of states is crucial, as it allows the LLM to effectively reason about each state and ensures that each state has a sufficient historical sample size for robust analysis.
Several design choices warrant specific attention. The volatility threshold is determined using a rolling 252-day median rather than a fixed value. This adaptive approach ensures that the threshold remains relevant across different market eras. What might have been considered "high volatility" in the low-volatility environment of 2017 would be considered "normal" in the post-COVID market landscape. The rolling median automatically adjusts for these shifts.
The resulting state strings are intentionally designed to be human-readable. For instance, a state might be described as "trending upward in a calm, overbought market." When these human-readable states are presented to DeepSeek, the LLM can leverage its extensive world knowledge to infer the historical implications of such conditions for risk. This qualitative judgment is precisely the type of insight the strategy seeks to harness.
Step 5: The LLM Risk Manager: Constructing the Policy Table
This step represents the strategic core of the entire system. On a monthly cadence, DeepSeek is tasked with analyzing the historical statistics associated with each market state and generating a policy table. This table outlines, for every identified state, whether the strategy should be fully invested, partially invested, or pull back from the market.
A pivotal design decision lies in how the LLM’s task is framed. While strategies that ask an LLM to predict directional movements (LONG/SHORT/FLAT) are common, they often encounter the same predictive limitations. The most effective framing positions the LLM as a risk manager, not a market forecaster.
Computing State Statistics
The initial phase involves computing the statistical measures that the LLM will use for its analysis. A one-day lag is incorporated into this calculation to prevent lookahead bias. Specifically, the market state observed at the close of day t-1 is used to inform decisions for day t.
The sharpe_like column is arguably the most critical metric within this statistical table. A strongly positive value indicates that, historically, when the market was in a particular state, AAPL exhibited favorable risk-reward characteristics on the subsequent trading day. Conversely, a strongly negative value suggests the opposite, while values near zero imply inconclusive historical evidence.
The Prompt: Framing the LLM as a Risk Manager
The system prompt is where the overarching philosophy of the strategy is embedded. Each sentence within the prompt has been carefully chosen for its deliberate impact. Three guiding principles underpin this prompt design:
-
Explicit Task Reframing: The prompt begins by clearly stating what the model should not do. For instance, "Your job is NOT to predict tomorrow’s price direction." This directive is crucial because LLMs are highly sensitive to task framing. Without this explicit instruction, the model can easily revert to its default tendency of attempting directional forecasting.
-
Default to Action, Penalize Inaction: The prompt includes a "Default bias: LONG. Most states should be LONG." This instruction is designed to counteract the LLM’s natural inclination towards conservatism when faced with uncertainty. In a long-only strategy targeting a stock with a positive long-term drift, maintaining a flat position carries a tangible cost—the missed opportunity of capturing the market’s positive expected return.
-
Strict JSON Output with Retry Mechanism: Requiring strict JSON output and providing the precise schema prevents the LLM from embedding extraneous prose within its responses, which can disrupt parsing. A retry mechanism is incorporated, and the
max_tokensparameter is increased to 2000. Earlier iterations, limited to 900 tokens, often resulted in truncated JSON responses, leading to silent parsing failures.
Pro Tip: Caching LLM responses is a critical optimization. The cache_key incorporates the month, symbol, model name, and a version tag (e.g., ‘longonly-v1’). This ensures that re-running the backtest does not incur additional API calls once the cache is populated. The cache file, a simple JSON dictionary, can be directly inspected to review the LLM’s monthly decisions.
Step 6: From Policy to Position: Calibrated Sizing with Volatility Targeting
The LLM’s output is a qualitative judgment—LONG full, LONG half, or FLAT. This must be translated into a quantitative measure: the fraction of capital to be allocated to a position. This conversion occurs in two sequential steps: first, mapping the LLM’s action to a base exposure level, and second, scaling this base exposure through volatility targeting.
Exposure Mapping
The personality of the strategy is defined by this exposure mapping. The three defined levels—1.0, 0.8, and 0.5—determine the aggressiveness with which the LLM’s risk signals translate into actual position adjustments. These levels are tunable parameters within the settings cell. For example, if the LLM is perceived as overly cautious, frequently signaling FLAT, increasing FLAT_EXP to 0.6 would retain more capital in play without altering the core prompt.
Volatility Targeting
Volatility targeting aims to maintain a relatively constant risk contribution from the strategy, irrespective of the prevailing market regime. For instance, if AAPL’s realized volatility is 0.30 (a stressed market condition) and the TARGET_VOL is set at 0.25, the scaling factor would be approximately 0.25 / 0.30 = 0.83. This results in the strategy automatically holding a slightly smaller position. Conversely, in a calm market with volatility at 0.15, the scaling factor would be 0.25 / 0.15 = 1.67. However, a MAX_LEVERAGE cap of 1.0 prevents the application of leverage, ensuring the position size does not exceed the allocated capital.
Momentum Tilt
A final overlay introduces a momentum tilt, adjusting the position size by +/- 15% based on the 63-day cumulative return. This adjustment is applied before the MAX_LEVERAGE cap. A positive 63-day cumulative return (indicating an uptrend) scales the position up by 15%, while a negative return (downtrend) scales it down by 15%. This feature imbues the strategy with a momentum bias without altering the LLM’s fundamental qualitative judgment.
The final position for the trading day is assembled in the build_agent_positions function. This function incorporates the lagged state (state_lag) and volatility (vol_lag) to ensure that the first day of each month is not artificially forced into a flat position due to the monthly re-evaluation process.
Execution Timing: The position pos[t] represents the allocation held throughout day t, determined at the close of day t-1. This position directly earns the return ret[t], with no subsequent adjustments or shifts. This constitutes a single-lag execution model: the state is observed at the close of t-1, the position is set, held through the close of t, and the return is collected. Crucially, this model incorporates no lookahead bias.
Step 7: Hard Guardrails: A Safety Net for Extreme Events
The LLM makes decisions based on historical statistical patterns. However, financial markets can exhibit unprecedented behaviors—flash crashes, unexpected macroeconomic announcements, or sudden liquidity crises. Hard guardrails provide a critical, independent layer of defense that operates outside the LLM’s direct judgment.
Three primary triggers can override the LLM’s position:
- Volatility Stop: If realized volatility surpasses a predefined
vol_stopthreshold AND short-term volatility (vol5) exceeds 80% of thevol_stopthreshold (an acceleration condition), the position is immediately cut to zero. Requiring both conditions prevents spurious exits triggered by single-day volatility spikes that quickly revert. - Drawdown Stop: If the strategy’s equity has declined by more than a
dd_limitfrom its peak AND the market trend is demonstrably broken (indicated by negative 63-day momentum and the price falling below the 50-day moving average), the position is also cut to zero. This trend-confirmation filter prevents premature exits during normal bull-market pullbacks where drawdowns are temporary. - Cooldown Period: Following the activation of either the volatility or drawdown stop, the strategy remains flat for a specified
cooldown_days.
A "warning zone" is also implemented. If the drawdown exceeds 60% of the dd_limit (a softer threshold), the current position is halved rather than exited entirely. This creates a tiered response: a warning (halve position) at 60% of the limit, a hard stop (exit plus cooldown) at 100%, and a forced re-entry after a predetermined MAX_FLAT_DAYS.
The Guardrail Deadlock Problem and Its Solution
A subtle but significant bug, known as the "guardrail deadlock," can silently incapacitate many drawdown-stop implementations. This issue plagued the strategy, leading to over 650 consecutive trading days with zero performance until it was identified and rectified. The deadlock occurs as follows:
The drawdown stop is triggered, setting the position to zero. Consequently, the strategy’s equity freezes, as a zero position generates no returns. With frozen equity, the peak equity remains perpetually above the current equity. This condition causes the drawdown check to be re-evaluated daily, consistently triggering the stop and maintaining a zero position. The cycle repeats indefinitely, locking the strategy out of the market.
A robust solution to this deadlock involves a re-entry counter. After MAX_FLAT_DAYS (set to approximately ten trading days), the re-entry gate opens. The strategy then re-enters the market at its full intended size, calculated as REENTRY_SIZE (set to 1.0) multiplied by the agent’s proposed position. Once re-entered, equity begins to accrue again. This allows the equity to either recover above the drawdown threshold or trigger another wait period. In either scenario, the deadlock is effectively broken.
Monthly Guardrail Re-optimization
The parameters for the hard guardrails—vol_stop, dd_limit, max_delta, and cooldown_days—are subject to a monthly grid search on the training window. This ensures that the guardrail thresholds adapt to new market conditions at the same frequency as the LLM’s risk assessment policy. While this process increases computational requirements per run (approximately 36 combinations each month), it maintains crucial alignment between the risk gates and the policy they are designed to protect.
Rationale for Monthly Re-optimization: Aligning both the LLM policy and the guardrail thresholds to a monthly cadence guarantees that the risk gates consistently reflect the same training window that informed the policy they are safeguarding.
Step 8: The Walk-Forward Loop: Ensuring Honest Out-of-Sample Testing
Walk-forward backtesting represents the most reliable method for achieving honest out-of-sample testing without the need to wait for future market events. The core principle is straightforward: at any given point in time, the model only has access to information that would have been available at that specific moment. This process strictly prohibits hindsight bias and prevents future data from influencing past decisions.
The strategy employs a monthly walk-forward loop. For each out-of-sample month, beginning from January 2023, the strategy trains on the preceding three years of data, constructs the LLM policy, and then simulates trading for the subsequent month. Critically, the equity curve and positions are carried forward continuously across these monthly blocks; there is no reset to an initial capital amount at the start of each month.
Following the completion of the loop, the monthly blocks are concatenated to form a single, continuous out-of-sample performance series. The equity curves for both the LLM-agent-only strategy and the LLM-agent with guardrails are then generated and analyzed.
Step 9: Performance Metrics and Results Analysis
Upon completion of the walk-forward loop, a standard suite of risk-adjusted performance metrics is computed for all three simulated equity curves: the agent-only strategy, the agent with guardrails, and a buy-and-hold benchmark. Presenting these metrics side-by-side is essential for a comprehensive evaluation, with the buy-and-hold benchmark serving as the most objective measure of the strategy’s added value.
CAGR vs. Sharpe Ratio: Distinct Perspectives on Performance
The strategy’s Compound Annual Growth Rate (CAGR), which ranges between 12.5% and 12.8% depending on the configuration, appears modest when compared to the buy-and-hold CAGR of 27.1%. However, this direct comparison can be somewhat misleading, as the strategies undertake fundamentally different levels of risk. The LLM-driven agents operate with an annualized volatility of 14.1% and 13.9%, respectively, significantly lower than AAPL’s historical volatility of 25%. When evaluated on a risk-adjusted basis through the Sharpe ratio, the performance gap narrows considerably.
The Trade-off: Guardrails Reduce Drawdown at the Cost of Return
The implementation of hard guardrails results in a slight reduction in CAGR, a consequence of the added caution. However, this comes with a significant benefit: the maximum drawdown decreases from -22% for the agent-only strategy to -18% for the agent with guardrails. Furthermore, during periods of market stress, the guardrails proved effective in preventing larger losses. The agent-plus-guardrails version emerges as a potentially more suitable choice for a risk-managed portfolio, while the agent-only version serves as a crucial baseline for quantifying the guardrails’ impact.
The Honest Takeaway: Risk Modulation, Not Alpha Generation
With the current set of state features and the LLM prompt, the strategy does not consistently outperform a passive buy-and-hold approach in terms of CAGR. The primary value derived from the LLM in this context is risk modulation, rather than direct alpha generation. If the objective is to participate in the upside potential of a stock like AAPL while simultaneously mitigating the most severe drawdowns, this strategy offers a potential solution. However, for investors aiming to outperform a passive index, the development of more predictive features is a clear direction for future research.
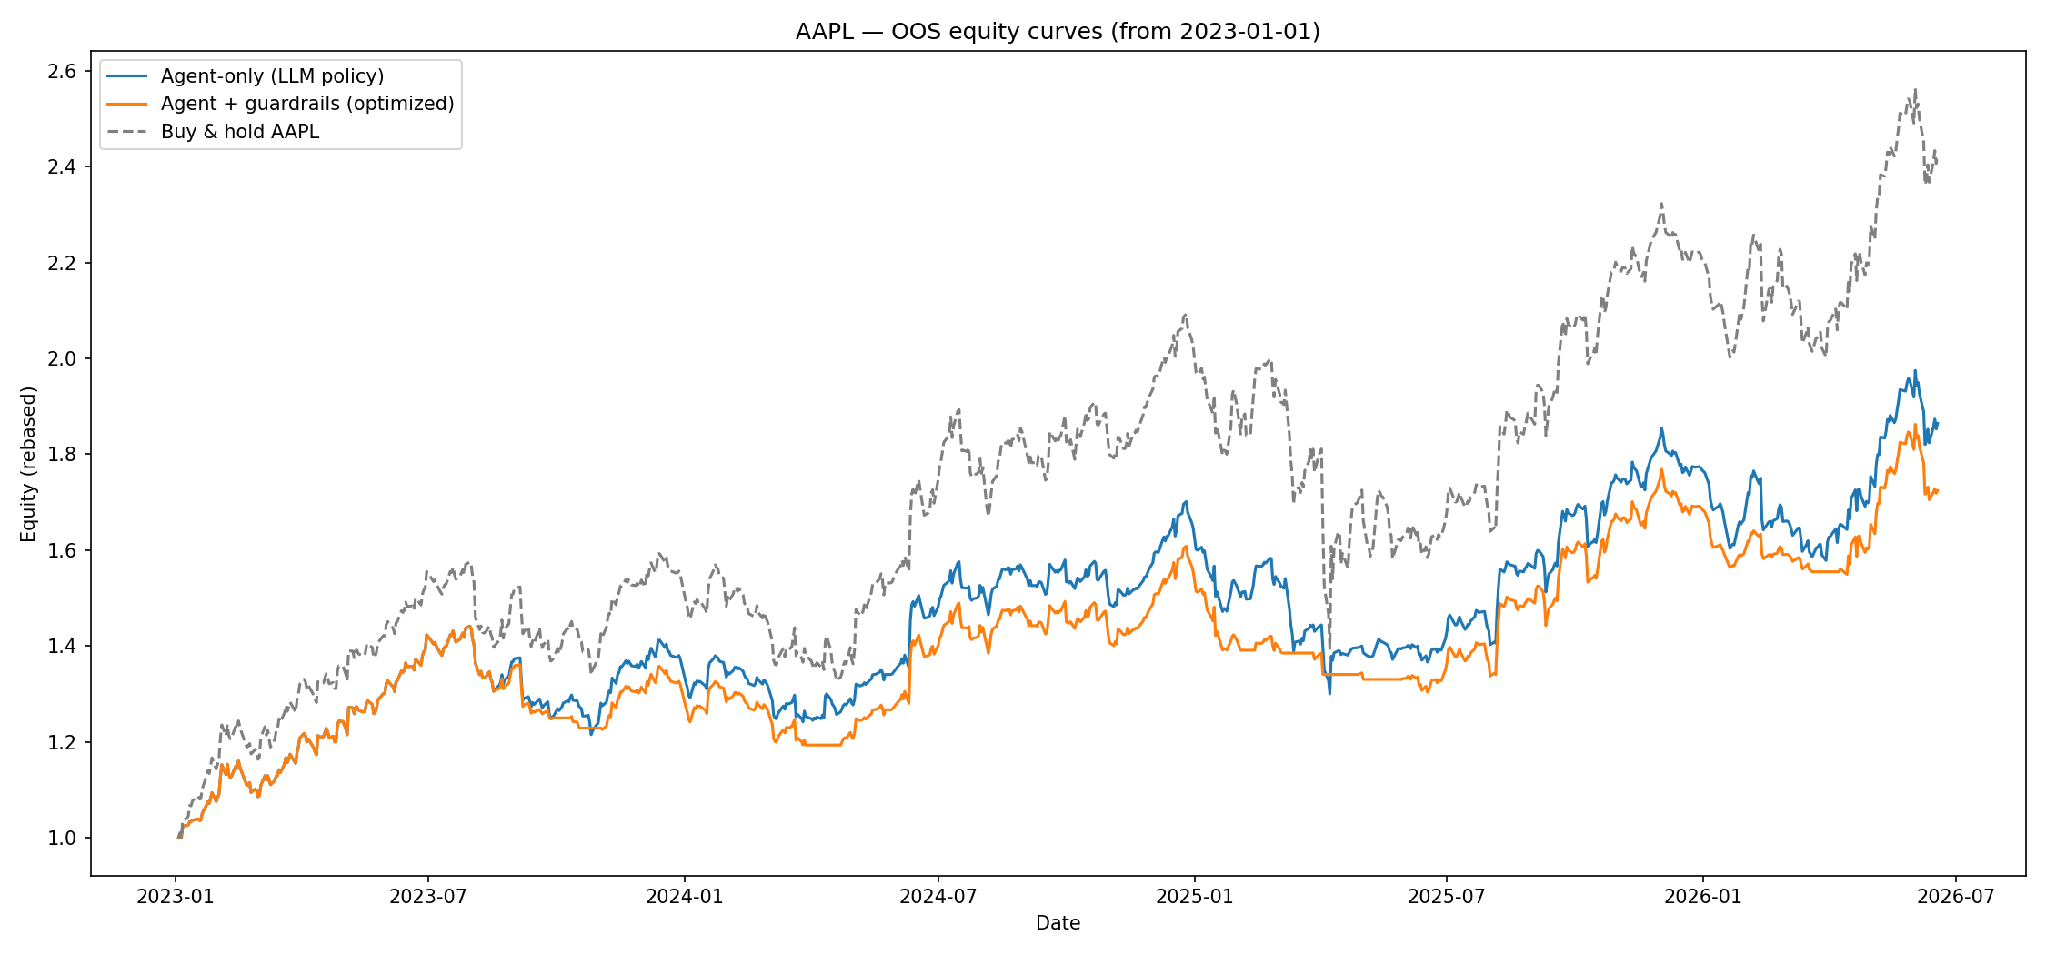
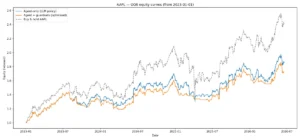
Figure: AAPL Out-of-Sample (OOS) Equity Curves (January 2023 – Present), all rebased to 1.0.
Interpreting the Equity Curves
Three key observations are evident from the accompanying equity curve chart. Firstly, all three curves demonstrate upward progression through 2023 and 2024, confirming the strategy’s ability to participate in AAPL’s uptrend. Secondly, the "Agent + Guardrails" curve consistently tracks the "Agent-only" line during market rallies. However, during market corrections, it detaches downwards more gradually. This divergence is a clear indication of the guardrails performing their function: trimming exposure before losses compound. Thirdly, the "Buy & Hold" strategy finishes highest, largely attributable to the unusually strong uptrend and shallow corrections observed in AAPL from 2023 to 2026. In more volatile or bearish markets, the lower volatility and reduced drawdown of the guardrailed strategy would translate into a more pronounced risk-adjusted advantage, as evidenced by a Calmar ratio of 0.91 for the strategy versus 0.88 for Buy & Hold.
Step 10: Pathways for Strategic Improvement
The strategy developed thus far serves as a robust foundation. The objective is not to present a definitive "best" strategy, but rather to offer insights and practical guidance that can empower users to enhance their own strategies or further develop this model.
Enhancing Signal Quality
- Multi-horizon Momentum: Incorporating 5-day and 63-day cumulative returns alongside the existing 20-day trend score can provide the LLM with a more nuanced understanding of whether the stock is in the early, mid, or late stages of a trend.
- Earnings Blackout: Mandating a FLAT_EXP position in the two trading days surrounding each quarterly AAPL earnings release can mitigate significant gap risk. Since earnings dates are publicly known, this introduces no lookahead bias.
- Macro Regime Filter: Adding a binary feature indicating whether the S&P 500 is trading above or below its 200-day moving average (this window can itself be optimized) can provide the LLM with broader market context, particularly valuable during widespread corrections where single-stock features may lag.
- Volume Z-score: Including today’s volume relative to its 20-day average as a state dimension can be informative. Unusually low volume often precedes reversals, while exceptionally high volume can confirm momentum.
Refining Position Sizing
- Kelly Fraction Hints: Calculating a fractional Kelly size for each state based on training statistics and providing this as a sizing hint to the LLM can lead to more optimized allocations. Using 25% of the full Kelly criterion helps avoid overbetting on potentially noisy estimates, with OOS Sharpe ratio improvements serving as the verification metric.
- Regime-Conditional Leverage Cap: During HIGH_VOL states, tightening the
MAX_LEVERAGEto 0.6, irrespective of volatility targeting outputs, can prevent rebuilding a full position into a still-stressed market following a guardrail re-entry. - Continuous Size Output: Prompting the LLM to output a continuous exposure level between 0 and 1, rather than discrete levels, can result in finer-grained position modulation and smoother equity curves. This approach, however, necessitates more rigorous output validation.
Strengthening Guardrail Robustness
- Relative Drawdown Limit: Replacing the absolute drawdown stop with one that compares strategy equity to buy-and-hold over the same window can prevent false exits during bull markets where an absolute drawdown might still represent relative outperformance.
- Noise-Filtered Volatility Stop: Requiring three consecutive days of elevated volatility before triggering the stop, rather than reacting to a single day’s spike, can effectively eliminate most spurious triggers from short-lived spikes that quickly revert.
- Separate Cooldowns: Implementing distinct cooldown counters for the volatility stop (e.g., 3 days) and the drawdown stop (e.g., 15 days) can acknowledge that volatility spikes normalize much faster than persistent drawdowns.
- Guardrail Optimization Frequency: Evaluating annual, semi-annual, and quarterly re-optimization cadences for guardrail parameters can identify the optimal balance between adaptability and robustness against overfitting. For slow-moving regimes, annual re-optimization may prove more stable than the current quarterly default.
Advancing LLM Prompting Techniques
- Comparative Ranking Prompt: Instructing the LLM to rank all states by their historical risk/reward and then assign exposure based on these rank tiers (e.g., top 50% receive full exposure, bottom 25% receive FLAT) can prevent scenarios where the model assigns favorable ratings to every state in isolation.
- Regime Classification First: Prompting the LLM to first classify the overall market regime (e.g., BULL, CHOP, or STRESS) before setting per-state exposure can anchor all decisions to a coherent macroeconomic view and generate a loggable regime label that can be plotted over the OOS period.
- Multi-Model Comparison: Running the same prompt through a second LLM (such as GPT-4o or Claude) and comparing the resulting OOS policies can provide a stronger signal of reliability. Consistent agreement between multiple models can be more indicative of signal quality than results from a single model.
Enhancing Evaluation Methods
- Rolling Sharpe Ratio Chart: Visualizing the rolling one-month Sharpe ratio over the OOS period can reveal whether the strategy’s edge is consistent or concentrated within specific lucky windows, offering a more granular performance analysis than a single aggregate number.
- Volatility-Targeted Benchmark: Including a volatility-targeted buy-and-hold strategy (always long but scaled to match the strategy’s volatility) in the metrics table is crucial. If the LLM strategy cannot outperform this benchmark, it suggests that the volatility-targeting module is contributing the majority of the performance improvement.
- Transaction Cost Sensitivity Sweep: Reporting results across a range of transaction costs (e.g., 0.5 bps, 1.0 bps, and 2.0 bps) can assess the strategy’s robustness. A strategy that performs well only under ideal, low-cost conditions may be fragile, whereas one that holds up at higher costs demonstrates a more durable edge.
Frequently Asked Questions
-
Q: Why use an LLM when a simple rule might suffice?
A: Simple rule-based systems are indeed implemented for comparison (e.g.,POLICY_MODE='rule'in the notebook). Running both and comparing metrics will reveal if the LLM adds demonstrable value. In tests, the LLM’s benefit has been observed in its ability to make smoother decisions across borderline states where historical statistics are ambiguous, preventing noisy flips that rule-based thresholds might exhibit. -
Q: What is the guardrail deadlock and why is it significant?
A: The guardrail deadlock occurs when a drawdown stop triggers, setting the position to zero. This freezes equity, preventing the drawdown from mathematically improving. The drawdown check subsequently re-fires daily, indefinitely locking the strategy flat. TheMAX_FLAT_DAYSre-entry counter resolves this by forcing a partial re-entry after a set period, regardless of the drawdown level. -
Q: Can this strategy be applied to other stocks?
A: Yes, with two primary adjustments. First, change theSYMBOLparameter and re-download the relevant data. Second, the LLM policy cache is keyed by symbol, necessitating fresh API calls for new tickers. The architecture is suitable for any liquid single stock or ETF with a substantial price history. For assets with less historical data than AAPL, reducingTRAIN_YEARSto 2 may be necessary to avoid overly sparse state statistics. -
Q: What are the API costs for running DeepSeek?
A: The walk-forward loop requires approximately 40 API calls per month, each withmax_tokens=2000. DeepSeek-chat is among the more cost-efficient frontier models, with a full OOS run costing under $0.10 at current pricing. Re-runs are free once the policy cache is populated. -
Q: What is the most impactful next step for performance improvement?
A: The single most impactful improvement lies in enhancing the quality of state features. The current three-feature state space (trend, volatility, z-score) is relatively coarse. Utilizingta-libtechnical indicators to enrich the signal quality is a promising avenue.
Conclusion: A Framework for LLM-Assisted Risk Management
The strategy presented herein serves as a framework for conceptualizing LLM-assisted risk management, rather than a definitive alpha-generating solution. The LLM earns its place not through market prediction, but by discerning nuanced distinctions between market states that a simpler rule-based system would handle with less precision.
The architecture comprises three distinct layers: Feature engineering and state bucketing translate raw price action into a format amenable to LLM reasoning. The LLM prompt, deliberately framed as a risk manager, establishes a monthly exposure policy across these states. Finally, hard guardrails, complete with a re-entry mechanism, ensure that no single adverse market event can permanently sideline the strategy.
The results demonstrate a strategy that effectively participates in AAPL’s upward trends while significantly reducing maximum drawdown by approximately 45% (from -33% to -18%) compared to a buy-and-hold approach. This represents a tangible and valuable characteristic for real-world portfolio management. While this is not necessarily the final iteration, the underlying framework is sound, the walk-forward methodology provides honest evaluation, and every design decision is transparent and traceable.
The most effective way to learn from this implementation is through active engagement: run the code, identify its limitations, and rebuild it. Experiment with prompt modifications, incorporate new momentum features, or substitute AAPL with a different asset like SPY. Observe the resulting performance changes. The provided notebook is designed for modification, with all parameters flowing from the initial settings cell.
Further Reading
For foundational knowledge in quantitative trading, explore the "Learning Track: Quantitative Trading for Beginners." To delve deeper into LLM applications in trading, the "Trading Using LLM: Concepts and Strategies" track offers practical, hands-on insights into implementing LLM models. Serious learners may consider the "Executive Programme in Algorithmic Trading (EPAT)," which covers statistical modeling, machine learning, and advanced trading strategies using Python.
References
[Chan, 2024] E. P. Chan, "Machine Learning in Trading," YouTube, 2024. Available: https://www.youtube.com/watch?v=VzF-tvz3DAk&t=411s
Note: The strategy concept originated from the author. The blog content was generated with AI assistance and subsequently curated and edited by the author.
Disclaimer: This blog is intended for educational and illustrative purposes only. Trading in financial markets involves substantial risk of loss. The code and concepts discussed herein do not constitute financial advice. Always exercise due diligence and ensure a thorough understanding of any automated trading system before deploying it in a live trading environment.