Nasdaq-100 Index Poised for Gains Following Technical Reversal from Key Support Level


The Nasdaq-100 index has demonstrated a significant technical reversal, emerging from a critical support zone and signaling a potential upward trajectory towards the resistance level of 29815.00. This development follows a period of consolidation and presents a compelling "buy" signal for market participants closely monitoring the technology-heavy index.
Technical Analysis Underpins Bullish Outlook
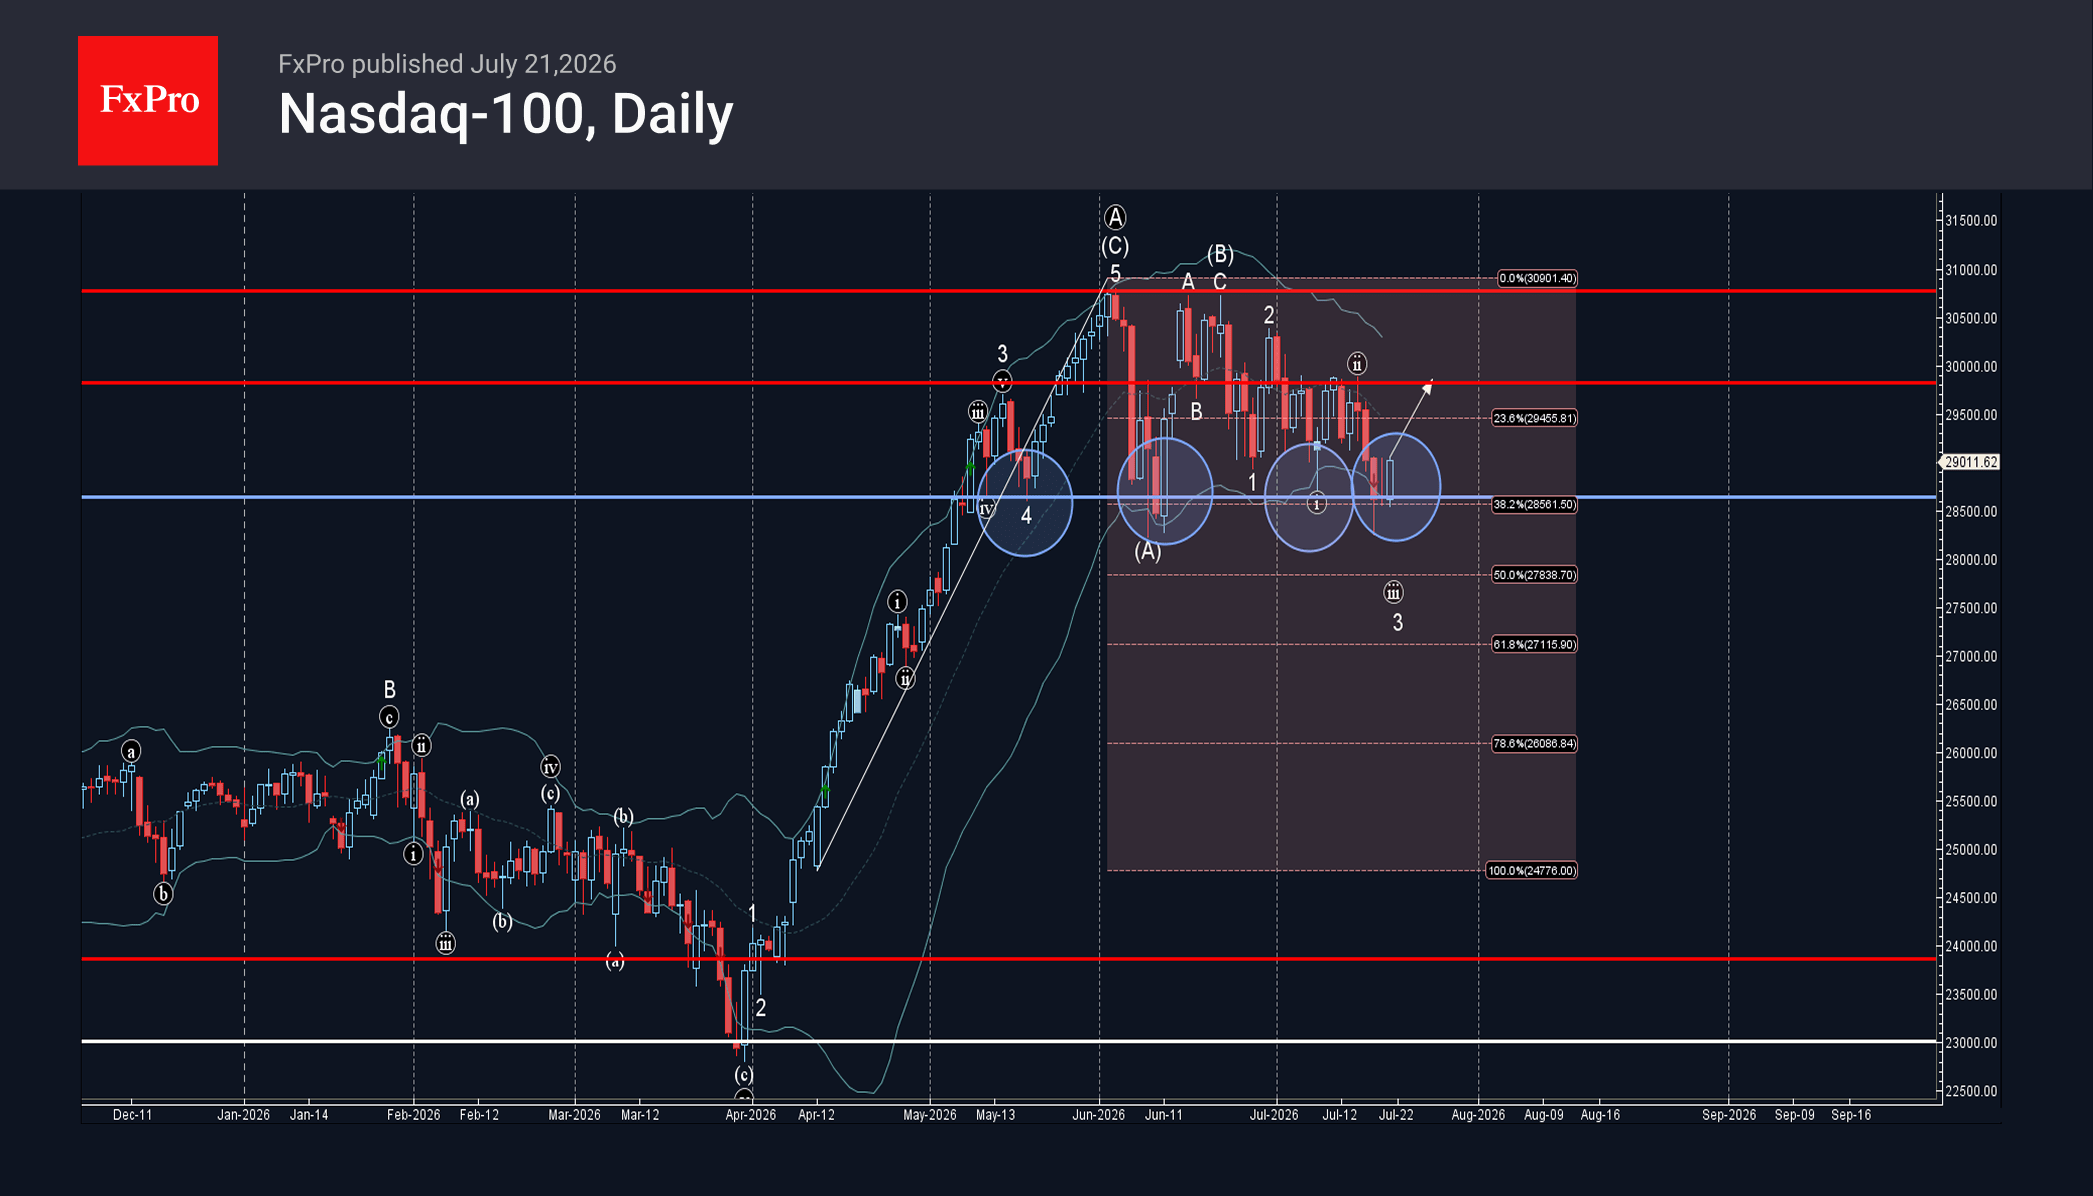
The recent price action of the Nasdaq-100 indicates a strong bounce from a confluence of technical indicators that have historically acted as a floor for the index. Specifically, the index found support between the 28630.00 level, a price point that has previously halted downward movements since May, and the lower boundary of the daily Bollinger Band. Compounding this support was the 38.2% Fibonacci retracement level of the upward impulse observed in April, further solidifying the area as a robust technical foundation.
This reversal from the 28630.00 support level has effectively arrested the progression of a minor impulse wave, designated as wave 3. The strength of this rebound, occurring within a broader daily uptrend, suggests that the market has absorbed selling pressure and is now poised for further appreciation. Analysts point to the established daily uptrend as a primary driver for this bullish outlook, indicating that the underlying momentum remains firmly to the upside.
The projected target for this anticipated rise is the next significant resistance level, identified at 29815.00. This level corresponds to the apex of the previous wave ii, a critical juncture in the broader Elliott Wave pattern that traders often use to identify potential turning points and price targets. The successful breach of this resistance could pave the way for further upward movement, although analysts remain watchful for any signs of renewed selling pressure.
Contextualizing the Nasdaq-100’s Performance
The Nasdaq-100, a prominent stock market index representing the 100 largest non-financial companies listed on the Nasdaq Stock Market, is a bellwether for the technology sector and broader economic sentiment. Its constituents include many of the world’s most influential technology and growth companies, making its performance a closely watched indicator of innovation, consumer spending, and corporate earnings.
Over recent periods, the Nasdaq-100 has experienced periods of volatility, influenced by a range of macroeconomic factors. These have included shifts in monetary policy, inflation concerns, geopolitical developments, and sector-specific headwinds and tailwinds. The index’s sensitivity to these factors stems from the growth-oriented nature of its constituent companies, which often rely on access to capital and sustained consumer demand.

The support zone at 28630.00, which has acted as a technical pivot point since May, highlights a sustained interest in the Nasdaq-100 at these price levels. This suggests that investors have viewed the index as undervalued or presenting an attractive entry point during periods of retracement. The fact that the index has now reversed from this zone, coupled with the supportive Fibonacci retracement, reinforces the notion that the underlying demand for these technology giants remains robust.
Chronology of Recent Market Movements
While the provided data focuses on a specific technical event, understanding the broader context requires a look at recent market dynamics. The period leading up to the reversal likely saw the Nasdaq-100 experience a pullback, potentially driven by profit-taking, concerns about specific industry trends, or broader market anxieties.
- Early May: The Nasdaq-100 establishes the 28630.00 level as a significant support, successfully reversing earlier downward pressure. This marks the beginning of a period where this level is tested and held.
- April: An upward impulse wave from earlier in April sets a preceding price structure, the retracement of which now forms part of the support zone.
- Recent Trading Sessions (leading up to July 21, 2026): The index experiences a minor impulse wave, potentially labeled as wave 3, which is then arrested by the aforementioned support zone. This signifies a pause or reversal in the short-term downward trend.
- July 21, 2026 (date of analysis): The Nasdaq-100 exhibits a clear reversal from the support zone, initiating a new upward movement. The analysis identifies 29815.00 as the next key resistance target.
This chronological perspective underscores the dynamic nature of market movements and the importance of identifying key technical levels that can signal shifts in sentiment and direction.
Supporting Data and Technical Indicators
The analysis relies on several key technical indicators that are widely used by traders and analysts:
- Support and Resistance Levels: These are price points where buying or selling pressure is expected to be strong enough to halt or reverse a price trend. The 28630.00 level has demonstrated its significance as a support, while 29815.00 is identified as the next hurdle.
- Fibonacci Retracement: This is a technical analysis tool used to identify potential support and resistance levels based on the Fibonacci sequence. The 38.2% retracement level is a commonly observed area where a price might find support after a significant move. In this case, it aligns with other support indicators, enhancing its significance.
- Bollinger Bands: These bands are volatility indicators that plot two standard deviations above and below a simple moving average. The lower band often acts as a dynamic support level, and the index reversing from it further validates the strength of the support zone.
- Elliott Wave Theory: This theory suggests that market prices move in predictable patterns, or "waves." The identification of an arrested "wave 3" and the projection towards the "top of the previous wave ii" are core elements of this analytical framework.
- Daily Uptrend: The overarching trend of the index on a daily chart is a crucial factor. A strong daily uptrend suggests that despite short-term pullbacks, the broader market sentiment is bullish, making a continuation of the upward move more probable.
These indicators, when used in conjunction, provide a comprehensive picture of the market’s technical landscape and potential future movements.
Implications for Investors and the Broader Market
The bullish technical signal from the Nasdaq-100 carries several implications for investors and the broader financial markets:
- Increased Investor Confidence: A sustained rise in the Nasdaq-100 can boost investor confidence, potentially leading to increased investment in technology stocks and other growth-oriented assets. This can create a positive feedback loop, further driving market momentum.
- Sectoral Performance: As a technology-centric index, a strong performance from the Nasdaq-100 often translates to positive sentiment for the technology sector as a whole. This could benefit companies involved in software, hardware, semiconductors, cloud computing, and digital services.
- Economic Indicators: The Nasdaq-100’s performance is often seen as a proxy for the health of the innovation economy and consumer spending on technology products and services. A rising index could suggest underlying economic strength and positive consumer demand.
- Risk Appetite: The Nasdaq-100’s upward movement generally coincides with a higher risk appetite among investors. This could lead to increased flows into equities and away from safer assets like bonds.
- Watchful Monitoring: While the current outlook is positive, market participants will remain vigilant. Any failure to reach the projected resistance level, or a swift reversal from it, could signal a shift in momentum and prompt a reassessment of the bullish thesis.
Expert Commentary and Market Sentiment
While direct quotes from specific market participants are not available in the provided text, the analysis presented by FxPro reflects a common approach among technical analysts. Such analyses are typically shared with clients and the wider trading community through financial news outlets and brokerage platforms.
The underlying sentiment conveyed is one of cautious optimism, grounded in technical data. Analysts like those at FxPro aim to provide actionable insights based on established charting techniques. The "Buy" recommendation is a direct consequence of the observed technical setup, indicating that the current conditions are deemed favorable for a speculative long position.
FxPro, as an award-winning online broker offering Contracts for Difference (CFDs) on a wide range of financial instruments, has a vested interest in providing timely and accurate market analysis to its global client base. Their focus on CFDs means that their analysis often targets traders who are looking for leveraged exposure to market movements.
Future Outlook and Potential Challenges
The projected rise to 29815.00 represents the next significant hurdle for the Nasdaq-100. Successfully breaching this level would be a strong confirmation of the bullish trend and could open the door to further upside targets. However, the path forward is not without potential challenges.
- Macroeconomic Shifts: Unexpected shifts in inflation data, interest rate expectations from central banks, or geopolitical events could rapidly alter market sentiment and impact the Nasdaq-100.
- Corporate Earnings: The upcoming earnings season for technology companies will be a critical factor. Stronger-than-expected results could fuel further gains, while disappointing reports could trigger sell-offs.
- Regulatory Scrutiny: Increased regulatory attention on large technology companies could pose a risk to the sector and, consequently, the Nasdaq-100.
- Valuation Concerns: Given the growth-oriented nature of many Nasdaq-100 constituents, ongoing debates about valuations and whether they are justified by underlying fundamentals will persist.
Traders and investors will be closely watching the Nasdaq-100’s progress towards the 29815.00 resistance level, paying particular attention to trading volumes and the reaction of the market to key economic news and corporate announcements. The strength of the current daily uptrend provides a solid foundation, but market dynamics are constantly evolving, requiring continuous analysis and adaptation.
The current technical picture for the Nasdaq-100 suggests a favorable environment for a short-to-medium term upward move. The confluence of support levels, coupled with the underlying bullish trend, has created an opportunity for potential gains, with the 29815.00 level serving as the immediate target for this anticipated advance.