Opening Range Breakout Strategy: A Complete Guide to Systematic Intraday Trading

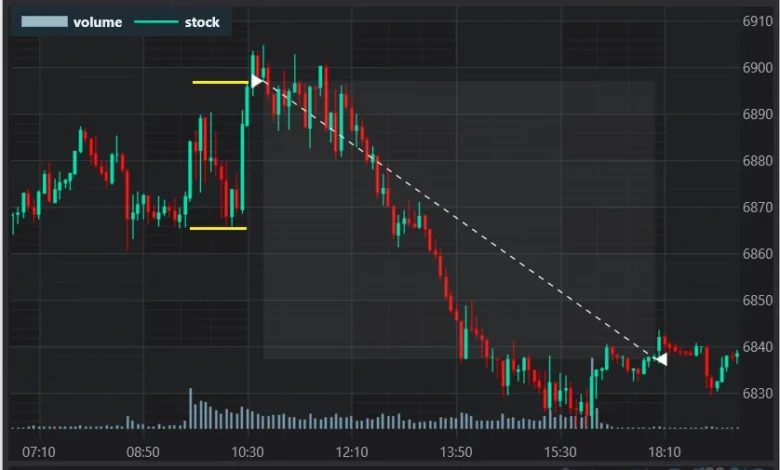
The Opening Range Breakout (ORB) remains one of the most thoroughly analyzed and widely deployed intraday systematic trading strategies in global financial markets. Designed to capture early session directional momentum, the ORB methodology relies on monitoring the high and low prices established during a defined opening window—typically ranging from the first 5 minutes to 60 minutes of a trading session. As institutional order flow collides with overnight macroeconomic data and pre-market positioning, these initial price boundaries serve as critical psychological and technical reference points. For decades, quantitative researchers, independent day traders, and institutional market-makers have studied how price reactions around these opening ranges dictate subsequent intraday trends. Building a robust ORB system, however, requires much more than simply identifying a breakout; it demands rigorous data validation, strict trade management, and an acute awareness of market regimes to prevent structural curve-fitting.
Understanding the Mechanics and Core Principles of Opening Range Breakouts
At its foundational level, an Opening Range Breakout strategy operates on a structured, four-step chronological framework. First, the trader defines the time window—often the first 30 minutes of regular trading hours—and records the absolute highest price (Opening Range High, or ORH) and absolute lowest price (Opening Range Low, or ORL) achieved during that period. Second, market participants exercise patience, letting the opening range form completely without executing premature entries during the initial price discovery phase. Third, once the designated time window closes, the strategy triggers trades based on directional commitment: buying when the price breaches the ORH or taking a short position when the price breaches the ORL. Finally, active trade management protocols dictate stop-loss placement, profit targets, trailing stops, or mandatory end-of-day liquidation.
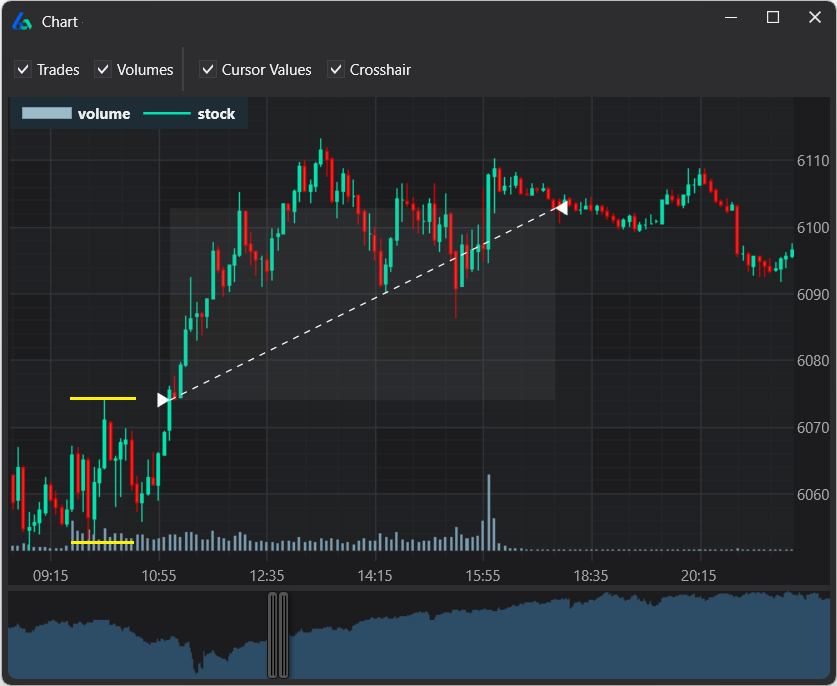
The persistence of the ORB edge is rooted in structural market behavior rather than arbitrary technical charting patterns. In the opening minutes of any trading day, market liquidity is densely concentrated, and institutional order flow reaches its intraday peak. Major financial institutions, pension funds, and macroeconomic hedge funds often execute large portfolio adjustments or overnight rebalancing decisions at the market open. This concentrated influx of capital generates substantial directional pressure. When price action forcefully pushes through the boundaries of the opening range, it signals that consensus has been reached, releasing the volatility compression built up during the pre-market session. Price discovery thrives in this environment, as overnight assumptions meet real-time market data, establishing a clear directional conviction for the remainder of the session.
Four Distinct Opening Range Breakout Trade Setups
While the classic ORB model involves an immediate entry upon a range breach, professional systematic traders and quantitative developers utilize multiple distinct setups based on how price interacts with the ORH and ORL levels.
The first and most direct variation is the Clean Breakout Above ORH (or below ORL). In this scenario, the asset’s price breaks decisively through the upper boundary of the opening range and continues its trajectory upward. Traders typically enter immediately upon the breakout confirmation, placing a protective stop-loss either just beneath the ORH or at the opposite end of the range (the ORL), holding the position until a pre-determined profit target or the end of the trading session is reached.

The second variation involves Fading the False Breakout. Markets frequently trap eager breakout traders by surging past the ORH before sharply reversing and plunging back inside the established range. Rather than chasing the initial momentum, counter-trend or adaptive systematic strategies capitalize on this failure. When prices fall back inside the range after a false breakout above the ORH, traders initiate short positions. The rationale is straightforward: the sudden reversal traps breakout long positions, forcing them to liquidate their holdings under duress, which accelerates the downward selling pressure.
The third and statistically highest-probability setup is the Retest and Limit Entry. Instead of chasing a raw breakout, this approach waits for price to break above the ORH, run higher temporarily, and then pull back to retest the original ORH level. Once the price touches the former resistance level and confirms it as newly established support, traders execute limit orders to buy at the ORH. This entry method offers a superior risk-reward profile, as the stop-loss can be placed tightly beneath the retested support level.
The final setup involves Trading Off Opposite Range Support. When a market remains range-bound or choppy inside the opening range, price may drift down toward the lower boundary, the ORL. In this setup, traders treat the ORL as a reliable support level, initiating long positions while placing stop-losses below the ORL, with a technical target aimed back toward the midpoint or the upper ORH boundary.
Comprehensive Risk Management, Trade Limits, and Filters

Deploying an ORB strategy in live market environments requires disciplined risk management and systematic trade constraints. Without proper controls, intraday volatility can quickly erode account equity.
Trade frequency limitation is one of the most vital safeguards for any ORB system. Unchecked algorithms that enter every single breakout signal on a choppy, directionless day will quickly accumulate a cascade of small losses through repeated false breakouts. Restricting systematic strategies to a maximum of one or two trades per session filters out unnecessary market noise and preserves capital.
Equally important is the enforcement of a forced end-of-day (EOD) exit. Intraday ORB strategies are expressly engineered to capture daily momentum and should never be converted into unintended swing trades. Holding intraday positions overnight exposes portfolios to unpredictable gap risk—such as geopolitical headlines or overnight macroeconomic announcements—that the underlying algorithm was never designed or backtested to handle. Automatically flattening all positions 15 minutes before the closing bell ensures the strategy remains strictly intraday.
Furthermore, professional developers utilize range-size filters to normalize market conditions. A universal challenge in intraday trading is that opening ranges vary dramatically in width from day to day based on recent market volatility. Dividing the Opening Range (OR) width by the Average True Range (ATR)—yielding an OR/ATR ratio—allows traders to filter out sessions where the range is either excessively wide (resulting in poor risk-to-reward metrics) or abnormally narrow (indicating insufficient momentum to sustain a directional move).

Common Pitfalls, Curve-Fitting, and Rigorous Validation
Despite its theoretical appeal, a significant percentage of manually developed ORB strategies fail when deployed live. The primary culprit is the trap of curve-fitting and parameter mining. If a developer tests dozens of arbitrary time windows—such as 5, 7, 10, 15, 20, and 30 minutes—combined with various stop-loss and profit-target variations across historical data, they are virtually guaranteed to find a combination that displays spectacular historical returns. However, this optimization is merely fitting the strategy to past market noise rather than capturing a genuine, repeatable market edge. Statistically, testing thousands of parameter combinations ensures that luck alone will produce impressive backtest results.
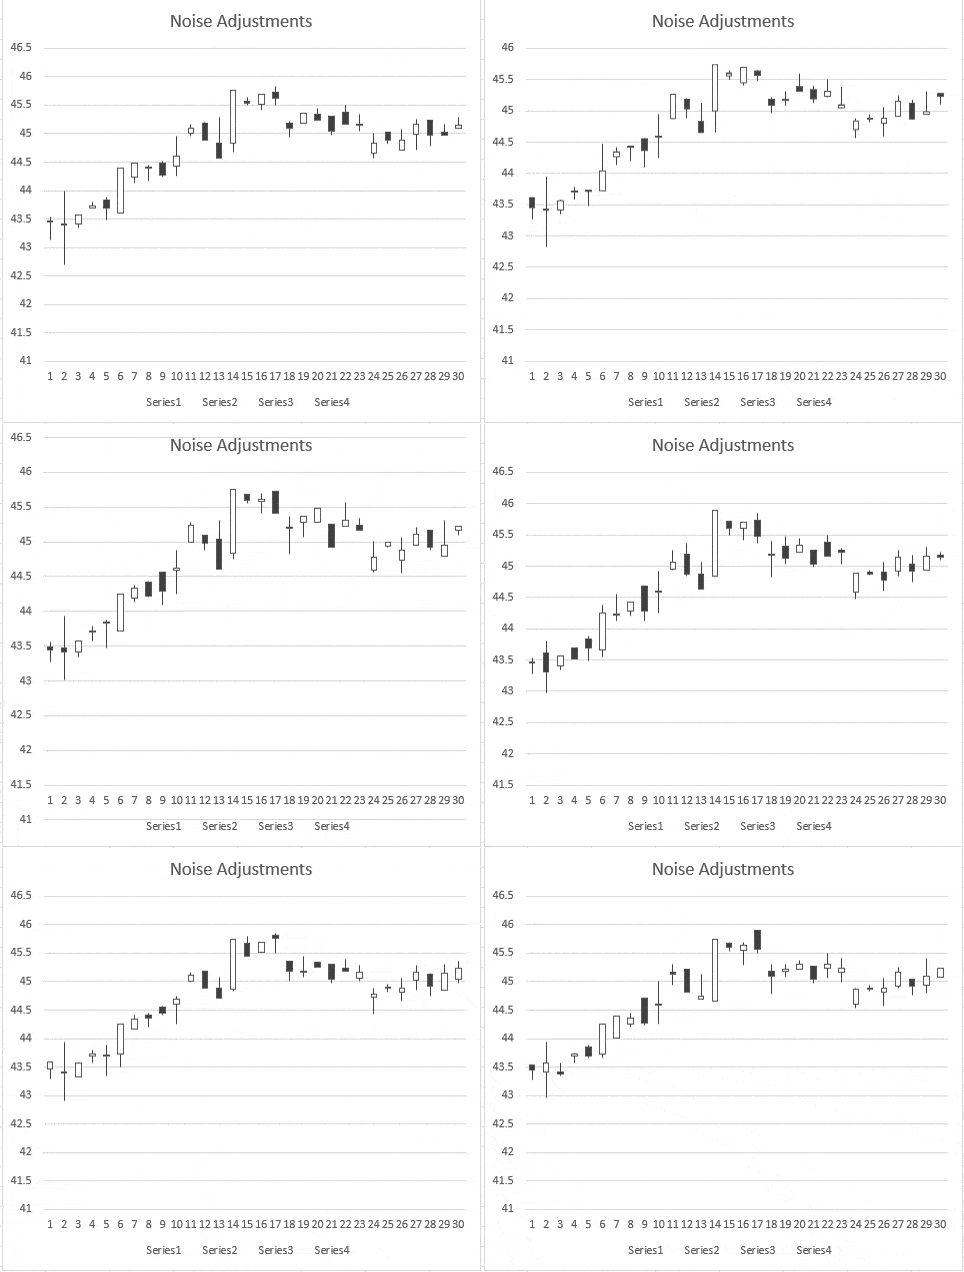
To separate genuine trading edges from statistical illusions, systematic strategies must undergo exhaustive robustness testing. Out-of-sample testing evaluates strategy performance on entirely unseen historical data that was excluded from the initial development phase. Walk-forward optimization tests stability across rolling time windows, while Monte Carlo simulations project a wide spectrum of possible future equity curves based on randomized trade sequencing. Additionally, noise testing determines whether a strategy’s profitability survives minor, randomized alterations in input data, and versus-random benchmarking confirms that the ORB system significantly outperforms random trade entries.
Advanced Optimization and Institutional Workflows

Modern quantitative researchers enhance baseline ORB strategies by integrating advanced macro and technical filters. By combining opening range rules with longer-term trend indicators—such as the 200-day moving average—volatility thresholds, or seasonal day-of-week effects, algorithms can dynamically switch off during unfavorable market regimes.
Moreover, institutional frameworks increasingly rely on diversified portfolios of uncorrelated ORB variations. Rather than relying on a single market or time window, quantitative desks deploy portfolios featuring different opening ranges (such as 5-minute scalping systems alongside 60-minute Initial Balance strategies) across diverse asset classes, including equity index futures, commodities, foreign exchange, and individual equities. This multi-market diversification reduces portfolio drawdown and stabilizes overall risk-adjusted returns, transforming a simple chart pattern into a resilient, institutional-grade systematic trading operation.