Weather Data Emerges as a Critical Edge in Modern Commodity Trading
The landscape of commodity trading is undergoing a significant transformation, with sophisticated market participants increasingly leveraging alternative data sources to gain a competitive advantage. Among these, historical and real-time weather data has emerged as a potent tool, offering deep insights into factors that directly influence agricultural yields, energy demand, and transportation logistics. Platforms like Build Alpha are now integrating comprehensive weather datasets, empowering traders with the same analytical capabilities that have propelled top-tier commodity desks to remarkable success, including a staggering $30 billion in profits for Citadel in the commodities sector since 2002.
The growing recognition of weather’s impact on financial markets is evidenced by the substantial investments hedge funds are making in specialized expertise. Reports from Bloomberg indicate that some funds are willing to allocate up to $1 million to acquire top-tier weather modelers, underscoring the perceived value of this data. This surge in demand highlights a shift in trading strategy, moving beyond traditional price-based analysis to incorporate a more holistic understanding of market drivers.
Citadel’s formidable success in commodity trading, particularly under the leadership of Sebastian Barrack, serves as a compelling case study. Since 2002, Citadel has amassed over $30 billion in commodity profits, with a remarkable half of these gains occurring in the last four years. This acceleration is attributed, in large part, to Barrack’s strategic implementation of weather models and physical tracking systems. The Financial Times has detailed how this innovative approach has allowed Citadel to dominate commodity markets, with the strategy at times contributing over 50% of the firm’s annual profits. This success story has directly influenced the development of Build Alpha’s integrated weather signal library, driven by client requests from energy market risk management specialists.
The Expanding Role of Weather Data in Diversified Markets
The utility of weather data extends far beyond its most obvious applications in agriculture and energy. Commodity markets encompassing metals and even stock index futures can find value in this alternative data. For instance, extreme weather events can disrupt mining operations, impacting the supply and price of metals. Similarly, weather patterns can influence consumer behavior and economic activity, indirectly affecting broader market sentiment and stock performance.
Build Alpha’s offering provides access to over 30 years of historical weather data, encompassing a wide array of crucial metrics. This dataset includes detailed temperature records, precipitation levels, Heating Degree Days (HDD), Cooling Degree Days (CDD), and information pertinent to agricultural zones and Petroleum Administration for Defense Districts (PADDs). The platform’s approach emphasizes not just raw data, but its normalized and contextualized presentation to facilitate systematic signal generation.
Understanding Key Weather Metrics for Trading
At the core of Build Alpha’s weather data offering are several key metrics, each with unique implications for trading strategies:
-
Temperature Data and Percentile Analysis: Beyond simple temperature readings, Build Alpha provides a smoothed, 10-year percentile rank. This metric compares current temperatures to historical norms for similar days, accounting for a 10-day window around the specific date. A reading in the 88th percentile, for example, signifies that the current temperature is higher than 88% of comparable days over the past decade. This normalization is crucial for identifying anomalies and generating reliable trading signals, as it allows for consistent comparisons across different seasons, years, and geographic locations. This methodology helps traders discern genuine deviations from the norm, which can precede significant market movements.
-
Precipitation Data and its Multi-faceted Impact: Precipitation levels have a direct and profound impact on agricultural yields. Excessive rainfall can delay planting seasons and lead to crop damage, while insufficient rainfall can stress crops, reducing their growth potential. However, the influence of precipitation extends beyond agriculture. It can affect port operations, leading to congestion and increased shipping costs. Furthermore, it can impact transportation via waterways, a critical component of global supply chains. In certain regions, heavy rainfall can also disrupt infrastructure projects, including mining and drilling operations, by rendering roads impassable. Behavioral finance also finds interest in precipitation data, exploring whether prolonged wet spells influence consumer spending habits or energy consumption patterns as people spend more time indoors.
-
Heating Degree Days (HDD) and Cooling Degree Days (CDD): These metrics are fundamental to understanding energy demand. HDD quantifies how "cold" a day was relative to a baseline of 65°F, indicating the likely need for heating in residential and commercial buildings. CDD, conversely, measures how "hot" a day was relative to the same baseline, correlating with the demand for air conditioning. Build Alpha provides both raw HDD and CDD values, along with their percentile ranks, offering traders a robust tool for forecasting energy consumption and price fluctuations. The calculation of HDD involves determining the difference between 65°F and the day’s average temperature (midpoint) if the average is below 65°F, otherwise, it’s zero. For example, if the high is 40°F and the low is 20°F, the midpoint is 30°F. The HDD would then be max(0, 65 – 30) = 35. Similarly, for CDD, if the high is 95°F and the low is 65°F, the midpoint is 80°F. The CDD would be max(0, 80 – 65) = 15.
Geographic Granularity for Targeted Insights
Build Alpha’s weather data strategy is underpinned by a carefully selected network of locations designed to provide actionable insights across key trading sectors.
-
Major U.S. Cities: Data is sampled from influential urban centers chosen for their proximity to financial hubs, significant population bases, and critical energy infrastructure. These include New York City (a global financial nexus), Chicago (home to major derivatives exchanges like CME Group), Houston (the undisputed energy capital of the U.S.), Los Angeles (a major West Coast population center), San Francisco (a hub for technology and Pacific trade), and Washington D.C. (the nation’s policy and regulatory epicenter).
-
Agricultural Zones: To cater to the agricultural commodity markets, Build Alpha includes data from six key crop-producing regions: the Corn Belt (covering states like Iowa, Illinois, and Ohio), the Delta States (Mississippi, Arkansas, Louisiana), the Great Plains (Kansas, Nebraska, the Dakotas), the Pacific Northwest (Washington, Oregon), the Southeast (Georgia, Carolinas, Virginia), and the Northeast (New England and Mid-Atlantic states). This granular data allows for precise analysis of factors affecting crop yields.
-
PADD Regions for Energy Trading: In alignment with the U.S. Energy Information Administration (EIA), Build Alpha incorporates weather data across the seven Petroleum Administration for Defense Districts (PADDs). These standardized geographic divisions are essential for tracking and analyzing petroleum supply and demand dynamics across the United States, providing critical context for energy traders.
The Strategic Advantage of Non-Price-Based Data
The success of systematic trading strategies often hinges on their ability to incorporate a diverse set of inputs that go beyond simple price action. Many automated trading systems falter due to a lack of contextual understanding of the market regime or the prevailing trading environment. Build Alpha emphasizes that integrating non-price-based data, such as weather patterns, is a powerful method for enhancing strategy stability.
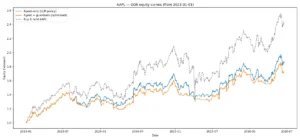
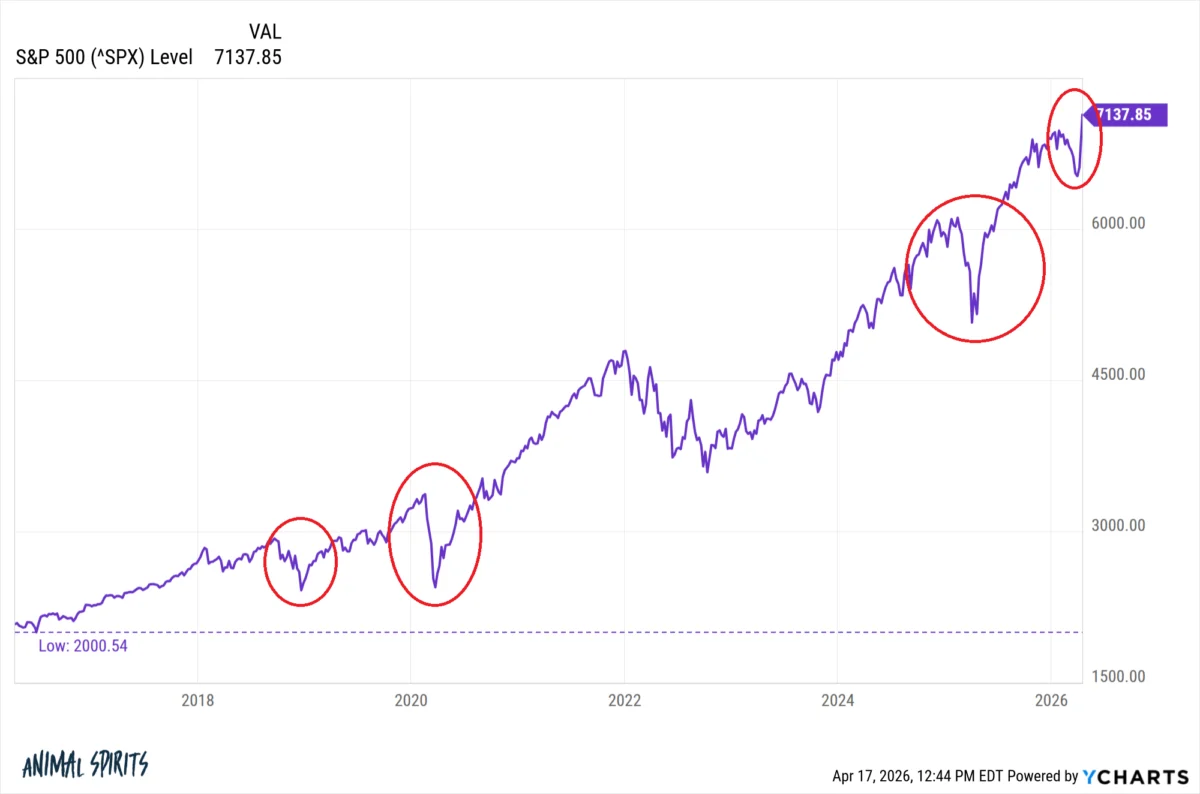
A practical demonstration of this is a corn futures trading strategy developed within Build Alpha. This strategy, characterized by a one-day holding period and volatility-based position sizing, exhibits a mere -0.02 correlation to a buy-and-hold S&P 500 strategy. This low correlation is a significant advantage, as it suggests that such weather-driven commodity strategies can serve as a valuable diversifier for equity portfolios, potentially mitigating losses during periods of significant market downturns in equities.
Automation and Customization: Empowering Traders
Build Alpha is designed to streamline the implementation of these advanced strategies. The platform can generate fully automatable code for any strategy created within its environment. This generated code seamlessly integrates with real-time weather data, alongside other price and non-price-based data offered by Build Alpha, and can be directly pasted into popular trading platforms such as TradeStation, MultiCharts, NinjaTrader 8, MetaTrader 4/5, ProRealTime, and TradingView. Furthermore, integration with Python and Interactive Brokers is supported, allowing for the incorporation of custom machine learning models and proprietary signals.
Beyond its built-in signals, Build Alpha offers a no-code custom indicator editor. This powerful tool allows users to create their own weather-based signals by combining historical weather data with mathematical functions, technical indicators, and other available datasets. For instance, a trader could develop a cumulative energy demand indicator by summing HDD values over a specified period. The platform’s strategy engine then enables the combination of these built-in and custom signals with sophisticated money management techniques, stop-loss levels, and position sizing methods, offering a highly customizable trading solution.
Future enhancements to Build Alpha’s weather signal library are anticipated to include data on extreme weather events, advanced climate modeling, comparisons between weather forecasts and actual experienced weather, cloud cover data, solar power generation metrics, and correlations between energy supply and long-term weather forecasts. The platform’s developer, David, has expressed enthusiasm for community feedback, highlighting that collaborative input is integral to the ongoing development and enhancement of the Build Alpha ecosystem.
Signals and Frequently Asked Questions
The comprehensive suite of weather signals available on Build Alpha includes:
- Temperature Percentile: A smoothed, 10-year percentile rank of daily temperatures, adjusted for anomalies.
- Precipitation: Daily precipitation data influencing agriculture, logistics, and infrastructure.
- Heating Degree Days (HDD): A measure of daily heating fuel demand, including raw values and percentile ranks.
- Cooling Degree Days (CDD): A measure of daily air-conditioning load and energy demand, including raw values and percentile ranks.
- Agricultural Zones: Data covering six key crop-producing regions across the U.S.
- PADD Regions: Data encompassing the seven Petroleum Administration for Defense Districts relevant to energy market analysis.
Frequently Asked Questions (FAQ) within the Build Alpha community address common queries:
- What is weather data in trading? It refers to the utilization of meteorological information as alternative data signals to predict market movements in commodities, energy, and agriculture.
- How does Citadel use weather data? Citadel leverages weather models and physical tracking to generate significant profits in commodity markets, with a notable portion of their success attributed to these strategies.
- What are HDD and CDD? These are metrics quantifying daily heating and cooling fuel demand, respectively, based on deviations from a 65°F baseline.
- What locations does Build Alpha cover? Build Alpha offers data for major U.S. cities, agricultural zones, and PADD regions.
- Can weather-based strategies be automated? Yes, Build Alpha generates automatable code compatible with major trading platforms.
- Can I create custom weather signals? Yes, Build Alpha provides a no-code editor for custom signal creation and supports Python extensions.
- Why use non-price-based data? It enhances strategy stability by providing contextual market information, improving diversification and reducing correlation to traditional portfolios.
- How much weather history is included? Build Alpha offers over 30 years of historical weather data that updates daily.
The integration of sophisticated weather data analytics into trading platforms like Build Alpha signifies a pivotal advancement in the quest for alpha. By providing traders with the tools to interpret complex environmental factors, these platforms are democratizing access to insights previously confined to elite trading desks, thereby leveling the playing field and fostering more informed, robust trading strategies across a wider array of markets. The ongoing development and refinement of these data-driven approaches promise to further reshape the future of financial trading.


