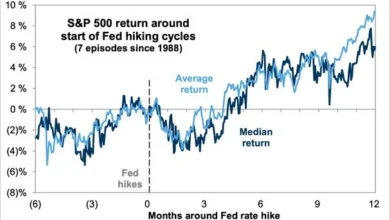
30-Year Treasury Yield still 5.06%, 30-Year TIPS Yield Highest since 2010 Reintroduction, Yield Curve Prepped for Rate Hike

This rapid ascent in yields reflects a fundamental repricing of risk in the sovereign debt market. Investors are grappling with two primary pressures: the persistent nature of inflationary forces and the massive supply of new Treasury securities required to fund expanding federal deficits. As the market adjusts to these realities, the cost of long-term borrowing is resetting at levels not seen in over a decade, with profound implications for the broader global economy.
The Mechanics of Real Yields and TIPS Protection
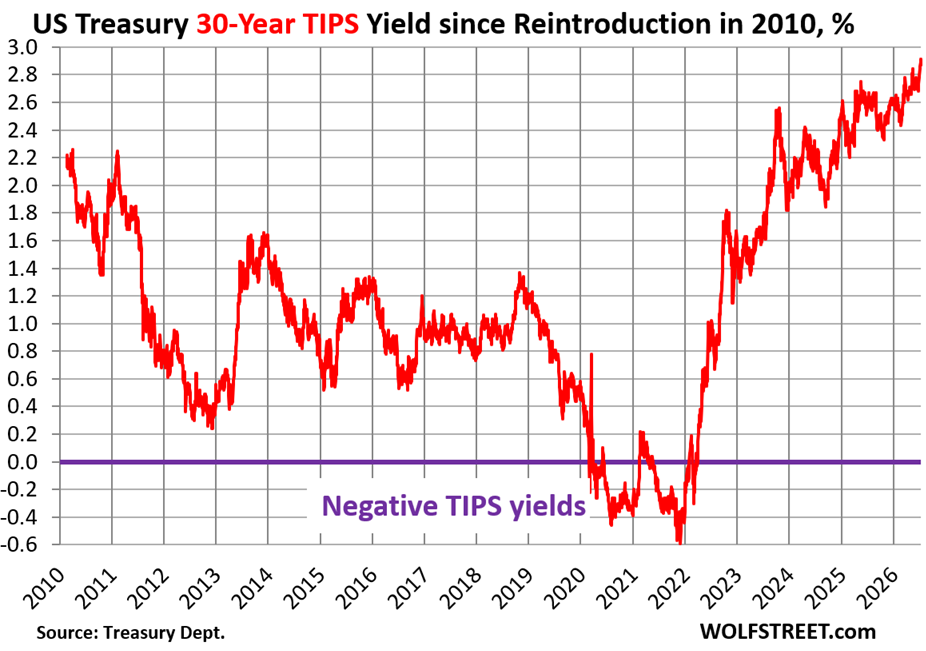
To understand the significance of the 2.91% yield, one must examine the unique structure of Treasury Inflation-Protected Securities. Unlike standard Treasury bonds, TIPS provide a dual layer of return. Holders receive a fixed coupon rate, but the principal of the bond is adjusted upward based on changes in the Consumer Price Index (CPI). When the bond matures, the investor receives the inflation-adjusted principal.
The current 2.91% yield is the "real yield"—the return an investor receives over and above whatever inflation turns out to be. Because the coupon interest rate is applied to the inflation-adjusted principal, as the principal grows with CPI, the dollar amount of interest payments also increases. This makes TIPS an essential barometer for market sentiment regarding real economic growth and the "term premium" required by investors to lock up capital for three decades.
In a hypothetical scenario where CPI inflation averages 2.15% over the next 30 years—matching the Federal Reserve’s long-term objective—a buyer at today’s 2.91% TIPS yield would realize a total nominal return of approximately 5.06%. This aligns closely with the current yield on regular 30-year Treasury bonds, which also closed the week at 5.06%. However, the divergence in outcomes becomes clear if inflation deviates from expectations. Should inflation average 3.5%, TIPS holders would see a total yield of 6.41%, while holders of standard 30-year bonds would remain capped at their original 5.06% coupon, effectively losing purchasing power.
From QE to QT: The Federal Reserve’s Pivotal Role
The trajectory of TIPS yields is inextricably linked to the Federal Reserve’s balance sheet policies. During the pandemic era, the Fed engaged in aggressive Quantitative Easing (QE), purchasing massive quantities of Treasury securities and Mortgage-Backed Securities (MBS). The Fed was particularly dominant in the TIPS market, which is significantly smaller and less liquid than the nominal Treasury market.
At its peak, the Fed’s intervention pushed the 30-year TIPS yield into negative territory, reaching -0.6% by late 2021. This meant investors were essentially paying the government for the privilege of inflation protection. However, the paradigm shifted when the Fed began tapering its purchases in late 2021, ending QE in early 2022, and subsequently launching Quantitative Tightening (QT) in the second half of 2022.
The withdrawal of the "buyer of last resort" has left the market to find its own price floor. Currently, the TIPS market stands at approximately $2.16 trillion, representing just 6.8% of the total $31.8 trillion in marketable Treasury securities. Despite the reduction in its holdings, the Fed still maintains a significant footprint, holding $380 billion, or roughly 17.6% of all outstanding TIPS. As the Fed continues to allow these assets to roll off its balance sheet, the private sector must absorb the supply, driving yields higher to attract sufficient demand.
A Chronology of the Bond Market Transition (2020–2026)
The transition from the era of "easy money" to the current high-yield environment has been characterized by extreme volatility and significant capital losses for long-duration investors.
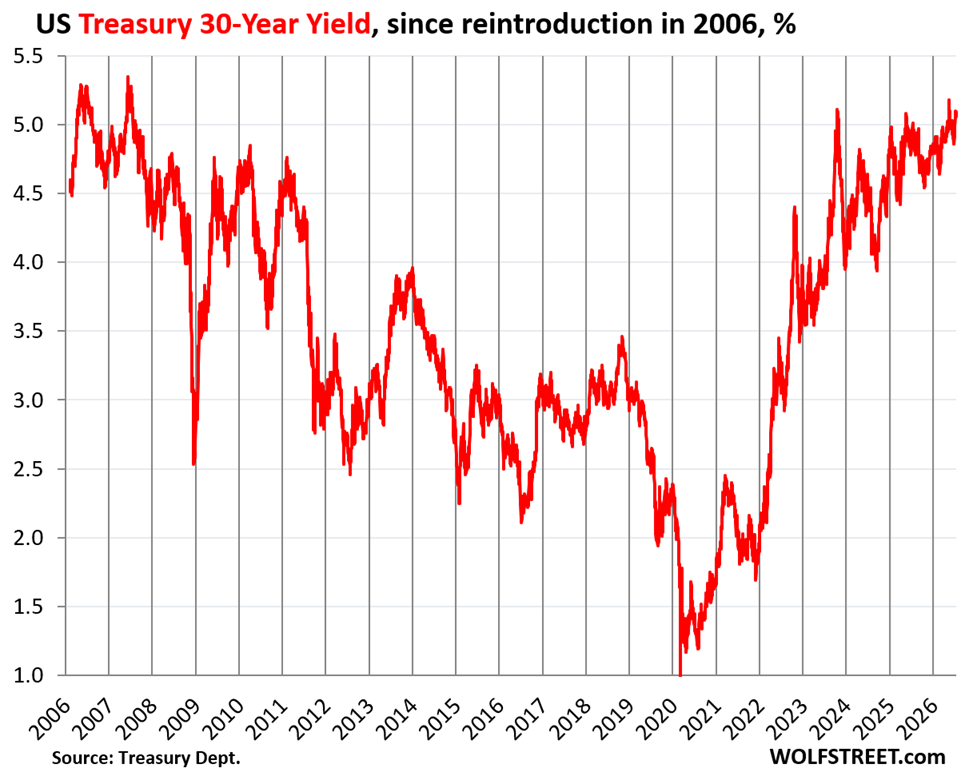
- March 2020: The 40-year bond bull market reaches its zenith. The 30-year Treasury yield plunges to a historic low of 1.0%, and briefly lower, as the pandemic triggers a flight to safety.
- August 2020: The U.S. Treasury auctions 30-year bonds at a yield of 1.406%. Investors, trusting "forward guidance" that rates would remain near zero indefinitely, load up on these long-dated assets.
- 2021–2022: Inflation begins to surge, eventually nearing 9%. The Fed pivots from viewing inflation as "transitory" to launching a series of aggressive rate hikes. TIPS yields begin their climb out of negative territory.
- Early 2023: The rapid rise in yields causes the market value of long-term Treasuries to collapse. This "duration risk" triggers the failure of several regional institutions, most notably Silicon Valley Bank (SVB), which held massive portfolios of long-term bonds purchased during the low-yield era.
- 2025–2026: After a brief period of rate stability and minor cuts in late 2025, inflation fears reignite. The yield curve shifts upward again, culminating in the July 2026 spike to 2.91% for the 30-year TIPS.
The "Bloodbath" for Long-Term Bondholders
The human and institutional cost of this transition is best illustrated by the price performance of bonds issued during the low-rate era. A 30-year Treasury bond issued in August 2020 (CUSIP 912810SP4) with a coupon of 1.406% currently trades at approximately 48 cents on the dollar. Investors who purchased this bond at par during the initial auction and held it to the present day have experienced a capital loss of 52%.
This destruction of value has forced a massive realignment in the banking and insurance sectors. While current buyers in the secondary market can purchase these same bonds at a steep discount—locking in a "yield to maturity" of over 5% as the bond eventually pulls back toward its $1,000 face value—the original lenders to the government have been "hosed," in the parlance of the market. This serves as a stark reminder that even "risk-free" government securities carry immense price risk when interest rates rise.
Analyzing the 2026 Yield Curve: Market Expectations
The current Treasury yield curve provides a roadmap for where the bond market believes the economy is headed. As of July 2026, the curve shows distinct shifts compared to the previous year.
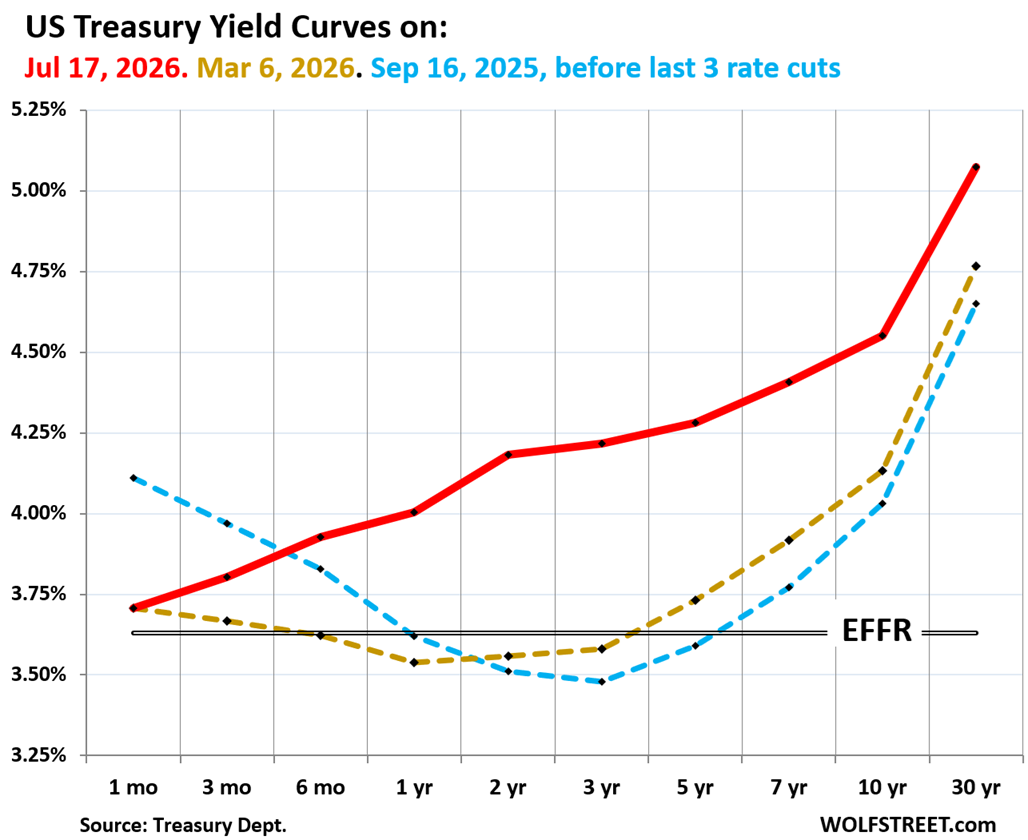
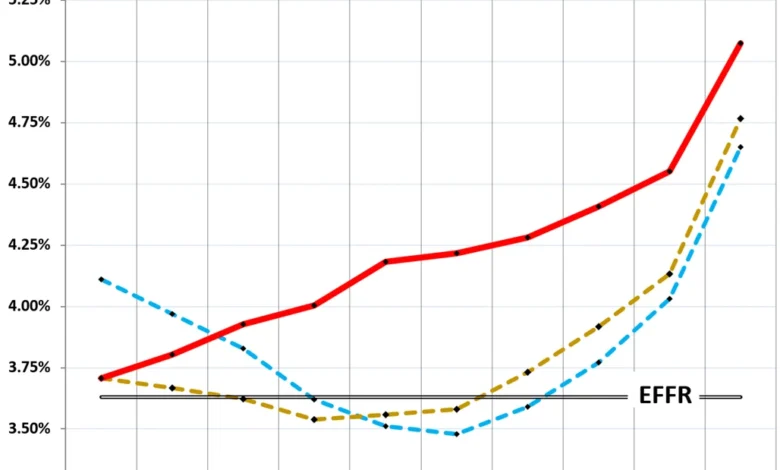
In early 2026, specifically around March, the market was pricing in the possibility of rate cuts, with short-term yields (1-year to 3-year) dipping below the Effective Federal Funds Rate (EFFR). However, by mid-July, the "red line" of the yield curve has moved significantly. While the 1-month yield remains anchored by the Fed’s current policy rate of 3.50% to 3.75%, the 6-month yield has climbed 30 basis points above the EFFR.
This inversion at the very front end suggests that the bond market is now prepping for a rate hike in the near term, followed by another potential hike in the following year, as indicated by the elevated 2-year yield. At the long end of the curve (10-year to 30-year), the rise in yields is driven less by immediate Fed policy and more by structural fears regarding the federal deficit and the "onslaught of new debt" required to service it.
Broader Impact and Economic Implications
The rise in long-term yields is not merely a technical concern for bond traders; it has tangible effects on the global economy. As the 30-year Treasury yield serves as the benchmark for many other forms of credit, its ascent to 5.06% exerts upward pressure on mortgage rates, corporate borrowing costs, and municipal debt.
- Housing Market Strain: Mortgage rates typically track the 10-year and 30-year Treasury yields. With yields at decade-highs, the cost of home ownership remains elevated, cooling demand and pressuring home prices in many regions.
- Federal Deficit Concerns: Higher yields mean the U.S. government must spend a larger portion of the federal budget on interest payments. This creates a feedback loop: higher interest costs increase the deficit, which requires more debt issuance, which in turn pushes yields higher as the market demands a premium to absorb the supply.
- Institutional Solvency: While the 2023 banking crisis was mitigated by government intervention, the continued rise in yields keeps pressure on the balance sheets of pension funds and insurance companies that rely on fixed-income returns. While new money can be invested at attractive rates, the "unrealized losses" on older holdings remain a point of vulnerability.
- Shift in Investment Strategy: For the first time in 15 years, "safe" government bonds are providing a meaningful real return. This may draw capital away from riskier assets, such as equities and high-yield corporate debt, as investors find the 2.91% real yield on TIPS to be an attractive alternative to the volatility of the stock market.
The current environment marks the end of the "Lower for Longer" era and the definitive arrival of "Higher for Longer." As the market adjusts to the twin pressures of persistent inflation and a mountain of federal debt, the 2.91% TIPS yield stands as a monument to the new reality of the American financial system. Whether these yields will continue to climb or stabilize depends on the Federal Reserve’s ability to anchor inflation expectations and the government’s ability to manage its fiscal trajectory in an increasingly expensive borrowing environment.