EUR/USD Technical Outlook: Sideways Consolidation Persists Above Key Support as Traders Weigh Medium and Long-Term Reversal Scenarios

The EUR/USD currency pair has maintained a tight sideways trading pattern above the crucial 1.1565 threshold, leaving the near-term technical outlook neutral as market participants assess the sustainability of recent price movements. Foreign exchange analysts are closely monitoring technical indicators, moving averages, and key Fibonacci retracement levels to determine whether the pair is preparing for a continuation of its broader upward trajectory or facing a deeper corrective pullback. With trading activity bound by well-defined parameters, market participants remain cautious while awaiting a definitive breakout that could dictate the currency pair’s direction for the upcoming weeks.
Current Market Dynamics and Short-Term Outlook
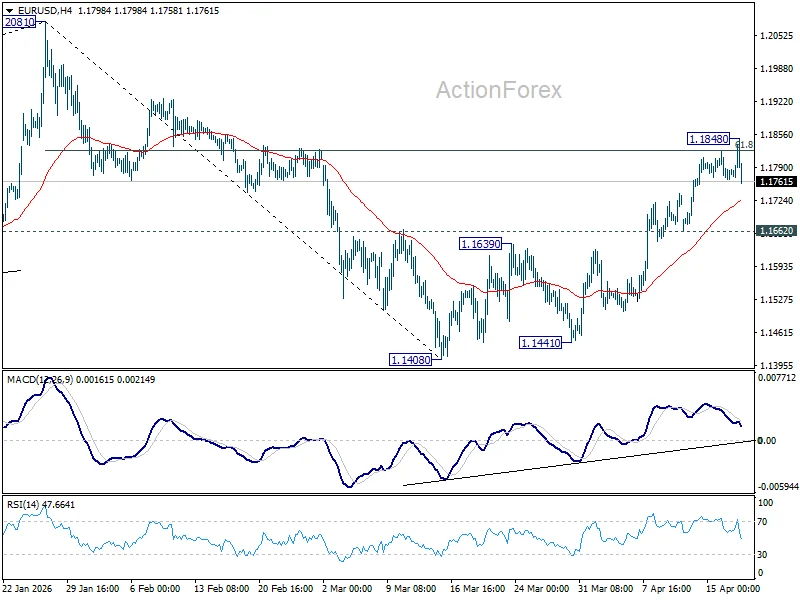
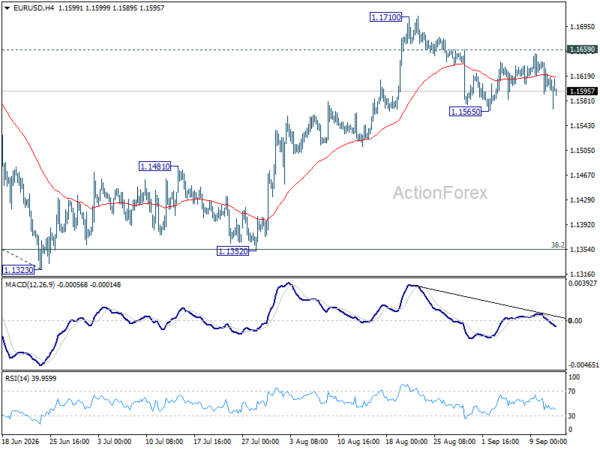
Entering the trading week, the initial technical bias for the EUR/USD remains predominantly neutral. Price action over the preceding sessions has been characterized by consolidation just above the 55-day Exponential Moving Average (EMA), which is currently positioned at 1.1565. This moving average serves as an immediate litmus test for market sentiment.
On the downside, a sustained break beneath the 55-day EMA would invalidate the recent constructive momentum. Such a move would strongly imply that the rebound from the 1.1323 low has concluded as a standard three-wave corrective pattern. In that scenario, technical models project a resumption of downward pressure, likely driving the pair toward a retest of the 1.1323 floor.
Conversely, buyers are attempting to defend the current range. A decisive move above the immediate resistance level at 1.1659 would preserve the integrity of the near-term recovery rally. If the pair manages to clear this hurdle, it would clear the path for a subsequent test of the 1.1710 resistance barrier, signaling renewed bullish conviction in the short-term horizon.
Medium-Term Perspective and Fibonacci Retracements
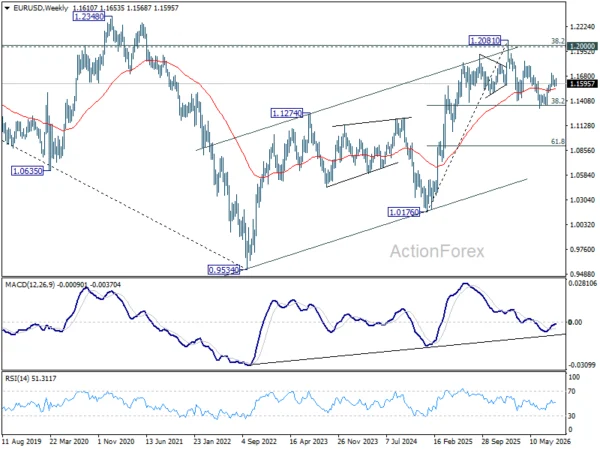
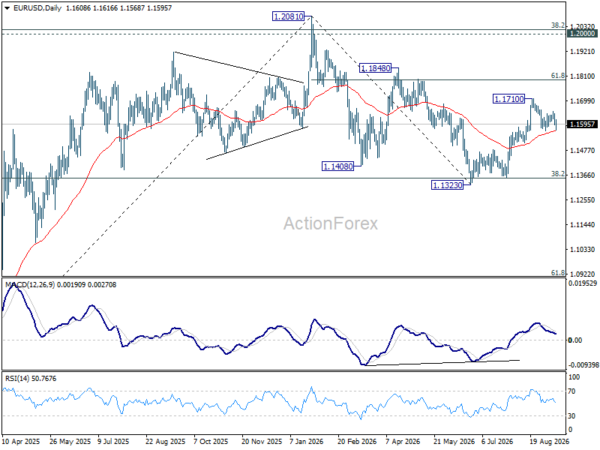
Looking at the broader medium-term picture, the structural integrity of the market remains tied to significant Fibonacci retracement levels established during previous multi-year cycles. The primary reference point is the 38.2% retracement of the upward surge from the 2025 low of 1.0176 to the peak of 1.2081, which sits at 1.1353.
As long as the EUR/USD holds above this 1.1353 threshold, ongoing price actions from the 1.2081 peak are interpreted merely as a healthy corrective phase within a larger, established bullish trend originating from the 1.0176 low. Market strategists suggest that once this corrective digestion completes, a renewed attempt to breach the 1.2081 resistance level remains the baseline expectation at a later stage.
However, risk management parameters dictate close observation of the downside boundary. A sustained violation and daily close below the 1.1353 support level would significantly alter the technical landscape, escalating the probability of a broader medium-term trend reversal and potentially inviting aggressive selling pressure.
Long-Term Outlook and Macroeconomic Implications
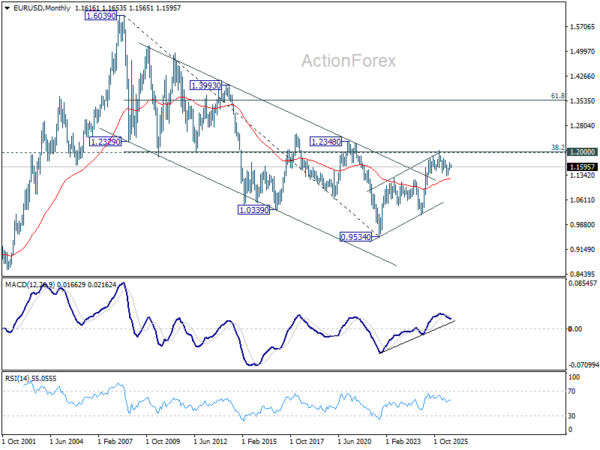
On a multi-year and secular scale, the EUR/USD is interacting with critical historical resistance levels that have defined its trading bands for decades. The focal point of the long-term outlook is the 38.2% retracement of the monumental decline from the historic 2008 high of 1.6039 to the generational low of 0.9534, calculated at 1.2019. This technical level converges closely with the vital psychological milestone of the 1.2000 handle.
A failure to conquer this resistance zone—marked by a definitive market rejection—would maintain the multi-decade downtrend originating from the 1.6039 peak, leaving the long-term outlook neutral at best. Such an outcome would reinforce the historical trading ranges that have constrained the European single currency against the US dollar over the past fifteen years.
Conversely, a decisive, structural break above the 1.2000/19 resistance band would carry profound macroeconomic and technical implications. Market analysts note that such a breakout would signal a long-term bullish trend reversal, effectively rewriting the multi-decade technical narrative for the world’s most heavily traded currency pair. Should this bullish scenario unfold, extended technical projections target the 61.8% retracement level situated at 1.3554.
Chronology of Recent Price Action
The development of the current trading range follows a structured sequence of market movements over the past several quarters:
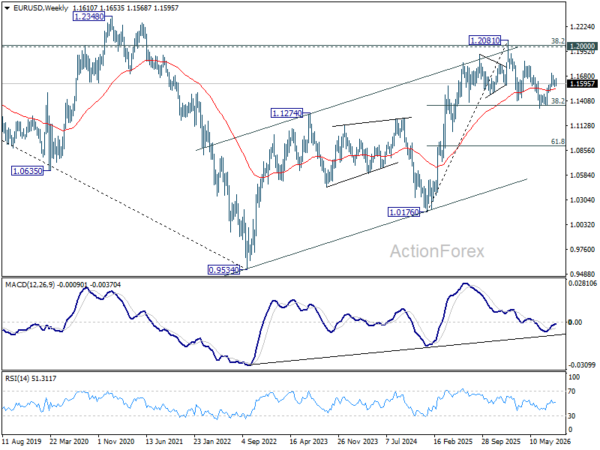
- 2025 Lows: The EUR/USD established a significant multi-year baseline at 1.0176, initiating a broader structural recovery phase.
- Peak Formation: Sustained buying pressure eventually propelled the currency pair to a cyclical high of 1.2081 before entering a corrective phase.
- Correction and Rebound: Following the pullback, the pair established a localized low at 1.1323, from which a subsequent three-wave recovery materialized.
- Recent Consolidation: Price action has since stabilized in a sideways band directly above the 55-day EMA at 1.1565, where it currently awaits its next directional catalyst.
Background Context and Market Influences
The ongoing consolidation in the EUR/USD occurs against a backdrop of shifting monetary policy expectations from both the European Central Bank (ECB) and the United States Federal Reserve. Macroeconomic data releases concerning inflation trajectories, employment figures, and gross domestic product growth on both sides of the Atlantic continue to drive intraday volatility.
While central bank policy divergence historically dictates the broader secular direction of exchange rates, current technical frameworks suggest that traders are heavily respecting technical boundaries. Asset managers and institutional investors are increasingly relying on key moving averages and retracement zones to manage portfolio risk, leading to the current contraction in volatility and range-bound behavior.
Implications for Forex Market Participants
For retail and institutional traders alike, the current technical stalemate requires a disciplined approach to risk management. The defined parameters—bounded by the 55-day EMA support at 1.1565 on the downside and the 1.1659 resistance on the upside—offer clear reference points for range-bound strategies. Meanwhile, breakout traders are maintaining strict stop-loss protocols while monitoring for a high-volume break of the medium-term 1.1353 support or the long-term 1.2000/19 psychological ceiling.
As the market digests incoming fundamental data and technical tests unfold, the medium-term direction of the world’s benchmark currency pair hangs in the balance, awaiting a decisive catalyst to break the prevailing equilibrium.
Related posts: