Bitcoin rallied through a rate hike but now faces a formidable challenge from a surging bond market


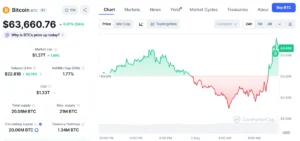
In mid-September, the outlook for Bitcoin appeared grim as macroeconomic headwinds converged. The legislative failure of the CLARITY Act on September 15, coupled with the Federal Reserve’s decision to hike interest rates to a range of 3.75% to 4.00% the following day, initially sent shockwaves through the digital asset space. Bitcoin (BTC) saw its price briefly dip below the $75,000 threshold, stoking fears among institutional and retail investors alike that the recovery phase had stalled. However, the market’s resilience was swift; within a week, the asset had reclaimed lost ground, surging past $87,000. Yet, this rally now faces a new, more persistent adversary: an aggressive and volatile shift in the United States bond market.
The Anatomy of the Bond Market Reversal
The recent turbulence in the fixed-income market began in earnest on September 23, when the yield on the 10-year US Treasury note spiked by more than 18 basis points. This move represented the most significant single-day increase since April 2025. The upward momentum did not dissipate; by the following day, yields climbed above 5.2%, reaching levels not witnessed since 2007. Simultaneously, the 30-year Treasury yield surged to approximately 5.50%, a benchmark unseen since 2004.
Market analysts have struggled to identify a single catalyst for this rapid repricing. Instead, a confluence of factors has driven the selloff. Strong Purchasing Managers’ Index (PMI) data suggested that the economy remained hotter than the Federal Reserve had anticipated, potentially necessitating a "higher for longer" interest rate environment. Furthermore, a lackluster five-year Treasury auction signaled waning demand for government debt, while rising oil prices stoked renewed inflationary concerns. Even a proactive move by the US Treasury—which executed a $4 billion buyback of long-dated bonds on September 24—failed to quell the rising tide of yields.
Why the Fed Hike Was Priced In
The resilience of Bitcoin in the immediate aftermath of the September 16 rate hike can be attributed to market efficiency. By the eve of the Federal Open Market Committee (FOMC) meeting, futures markets had priced in the 25-basis-point hike with nearly 90% certainty. Consequently, the downward pressure observed in early September was, in many ways, a pre-emptive adjustment rather than a reactionary panic.
This sentiment was mirrored in the data provided by spot Bitcoin exchange-traded funds (ETFs). According to Farside Investors, these products saw outflows of approximately $750 million on September 15 and 16. However, the subsequent rebound was substantial, with inflows totaling $2.39 billion in the week ending September 25. This marked the strongest weekly performance for spot Bitcoin ETFs since October 2025, underscoring a robust appetite for the asset despite the tightening monetary environment.

The Divergence: Why Bonds Present a Different Risk
While the Fed’s rate hike was a singular, predictable event, the ongoing bond market selloff is an open-ended phenomenon. When the Federal Reserve adjusts rates, the market reacts to a known quantity. In contrast, a bond market selloff is characterized by a lack of clear boundaries, forcing investors to grapple with the uncertainty of where yields will eventually peak.
At yields exceeding 5%, US Treasuries offer a "risk-free" return that competes directly with non-yielding assets like Bitcoin. This shift in the opportunity cost of capital is arguably the most significant headwind for the crypto market. Furthermore, there is a secondary, long-term implication: the US government’s fiscal trajectory. If the Treasury is forced to continue borrowing at elevated interest rates, the national deficit is projected to expand, which in turn necessitates a higher supply of bonds. While many proponents of decentralized finance argue that this long-term debasement of fiat currency serves as a fundamental bullish case for Bitcoin, the immediate short-term effect is one of liquidity contraction as capital flows toward the higher yields offered by traditional debt instruments.
Technical Analysis: Breaking the Bear Market Cycle
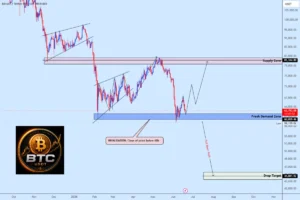
From a technical perspective, the price action on the 3-day chart provides a nuanced view of the current state of the market. Bitcoin’s breach of the $70,000 resistance level on August 20 initiated a period of consolidation around $80,000. The subsequent breakout last week was significant, as it represented the first "higher high" on higher timeframes since the onset of the bear market.
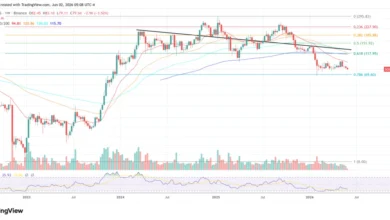
The moving averages further support this bullish structural shift. For the first time since the bear market began in November 2025, the 20-period Exponential Moving Average (EMA) has crossed above the 50-period EMA on the 3-day chart. This "golden cross" is widely interpreted by technical analysts as a potential indicator of a sustained trend reversal.
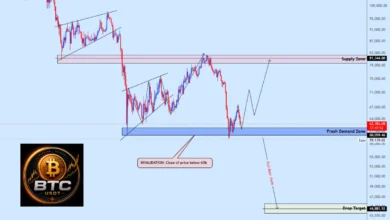
Currently, Bitcoin is undergoing a healthy retracement. Key support is identified in the $80,000 region, which aligns closely with the 50% Fibonacci retracement level of the most recent leg up (from $75,000 to $87,000). As long as the asset maintains support above $80,000, the broader market structure remains constructive. A definitive breakdown below this level, however, would likely invalidate the recent higher-high signal and force a reassessment of the current recovery trajectory.
Navigating Volatility in a Multi-Asset Environment
The intersection of crypto-native price movements and broader macroeconomic volatility has necessitated a more sophisticated approach to risk management for market participants. For investors looking to navigate the current environment—whether anticipating a continuation of the rally or preparing for a deeper pullback—platforms like PrimeXBT offer a bridge between digital and traditional assets.

The current volatility is not limited to Bitcoin; it is equally apparent in Gold, major US Dollar currency pairs, and global equity indices. The ability to hedge against bond yield fluctuations by taking long or short positions on correlated assets is becoming an essential component of modern portfolio management. For instance, the use of Crypto Futures and CFDs allows for granular control over exposure, particularly when using advanced order types to protect against sudden market reversals.
As the market digests the implications of the current bond selloff, the focus for traders has shifted from simple "buy and hold" strategies to active position management. With the market testing the $80,000 support level, the next few weeks will be critical in determining whether Bitcoin can decouple from the yield-driven pressure or if it will consolidate further as it seeks a new equilibrium.
Broader Implications for Financial Markets
The current situation highlights the increasing integration of Bitcoin into the global financial architecture. As ETFs have bridged the gap between Wall Street and crypto, Bitcoin has become more susceptible to the same macro-drivers that impact traditional asset classes. The "decoupling" narrative, which suggests that Bitcoin moves independently of the traditional banking system, is being tested as the asset reacts in real-time to shifts in the US Treasury market.
While the short-term correlation with rising yields has created friction, the fundamental demand for digital assets remains elevated. The record-breaking ETF inflows in late September suggest that institutional interest remains undeterred by the volatility. However, the market’s ability to sustain these gains will depend heavily on whether the Federal Reserve can navigate a "soft landing" or if persistent inflation forces them to maintain restrictive policies that keep bond yields at multi-decade highs.
Ultimately, investors are looking for clarity. The ambiguity surrounding the bond market’s endpoint is the primary source of the current tension. Until yields show signs of stabilizing, the market will likely remain in a state of high sensitivity, reacting sharply to any data points related to inflation, employment, or fiscal policy. For those monitoring the charts, the $80,000 support level stands as the primary barometer of market health. A failure to hold this level could signal a return to the accumulation phase, while a bounce would reinforce the notion that the market has successfully absorbed the shock of both interest rate hikes and the subsequent bond market repricing.
As the financial landscape continues to evolve, the tools used to measure and mitigate these risks will become increasingly important. Whether through traditional instruments or new-age digital assets, the goal remains the same: to identify the trend, manage the risk, and remain disciplined as the market works through one of its most challenging macroeconomic cycles in recent history.