Part 5 of 6: Statistical Arbitrage for Independent Traders

The evolution of quantitative trading strategies has long been defined by the pursuit of more efficient capital allocation and enhanced risk-adjusted returns. In the realm of equity statistical arbitrage, traditional pairs trading has served as the foundational model for decades. However, the inherent limitations of trading isolated pairs—where a significant portion of capital is tied up in fair-value hedge legs that act merely as passive riders—have driven researchers and independent traders to explore network-based methodologies. Among these, triangulated statistical arbitrage has emerged as a compelling paradigm shift, transforming how market participants identify, evaluate, and trade asset mispricings across an interconnected universe of equities.
Understanding the Mechanics of Triangulated Stat Arb
The nomenclature of triangulated statistical arbitrage is borrowed directly from traditional navigation and surveying. In geodesy, taking a single bearing on a landmark provides a line of position, while a second bearing intersects to form a point. When three or more independent bearings converge on the same coordinate, a definitive "fix" is established.
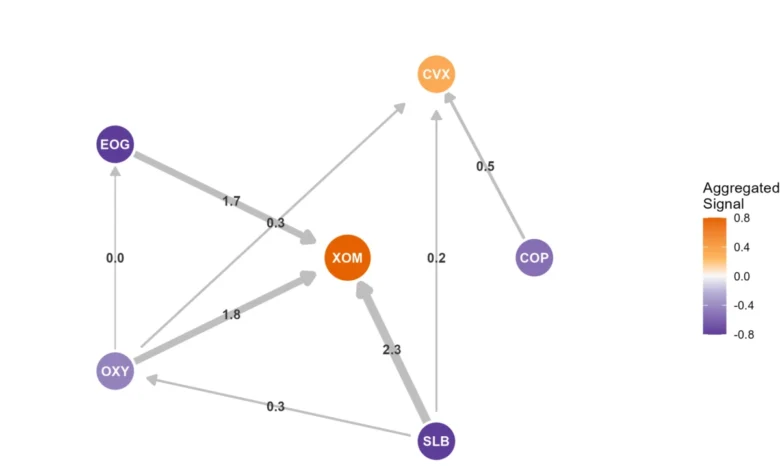
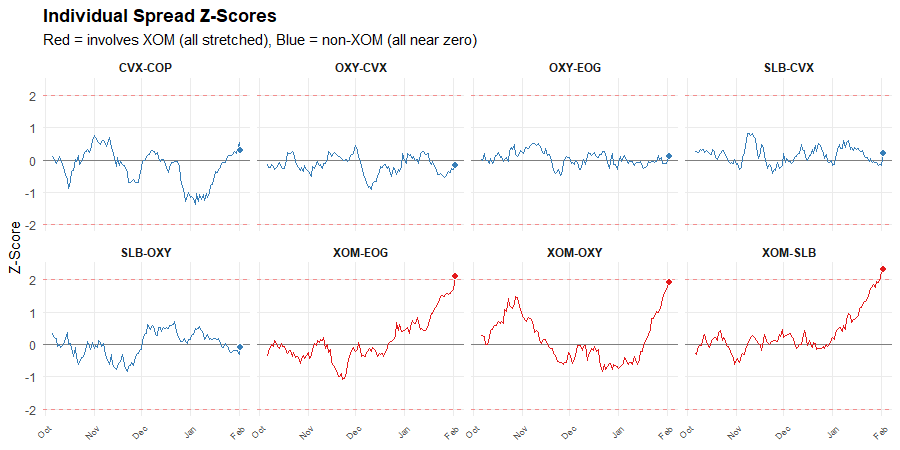
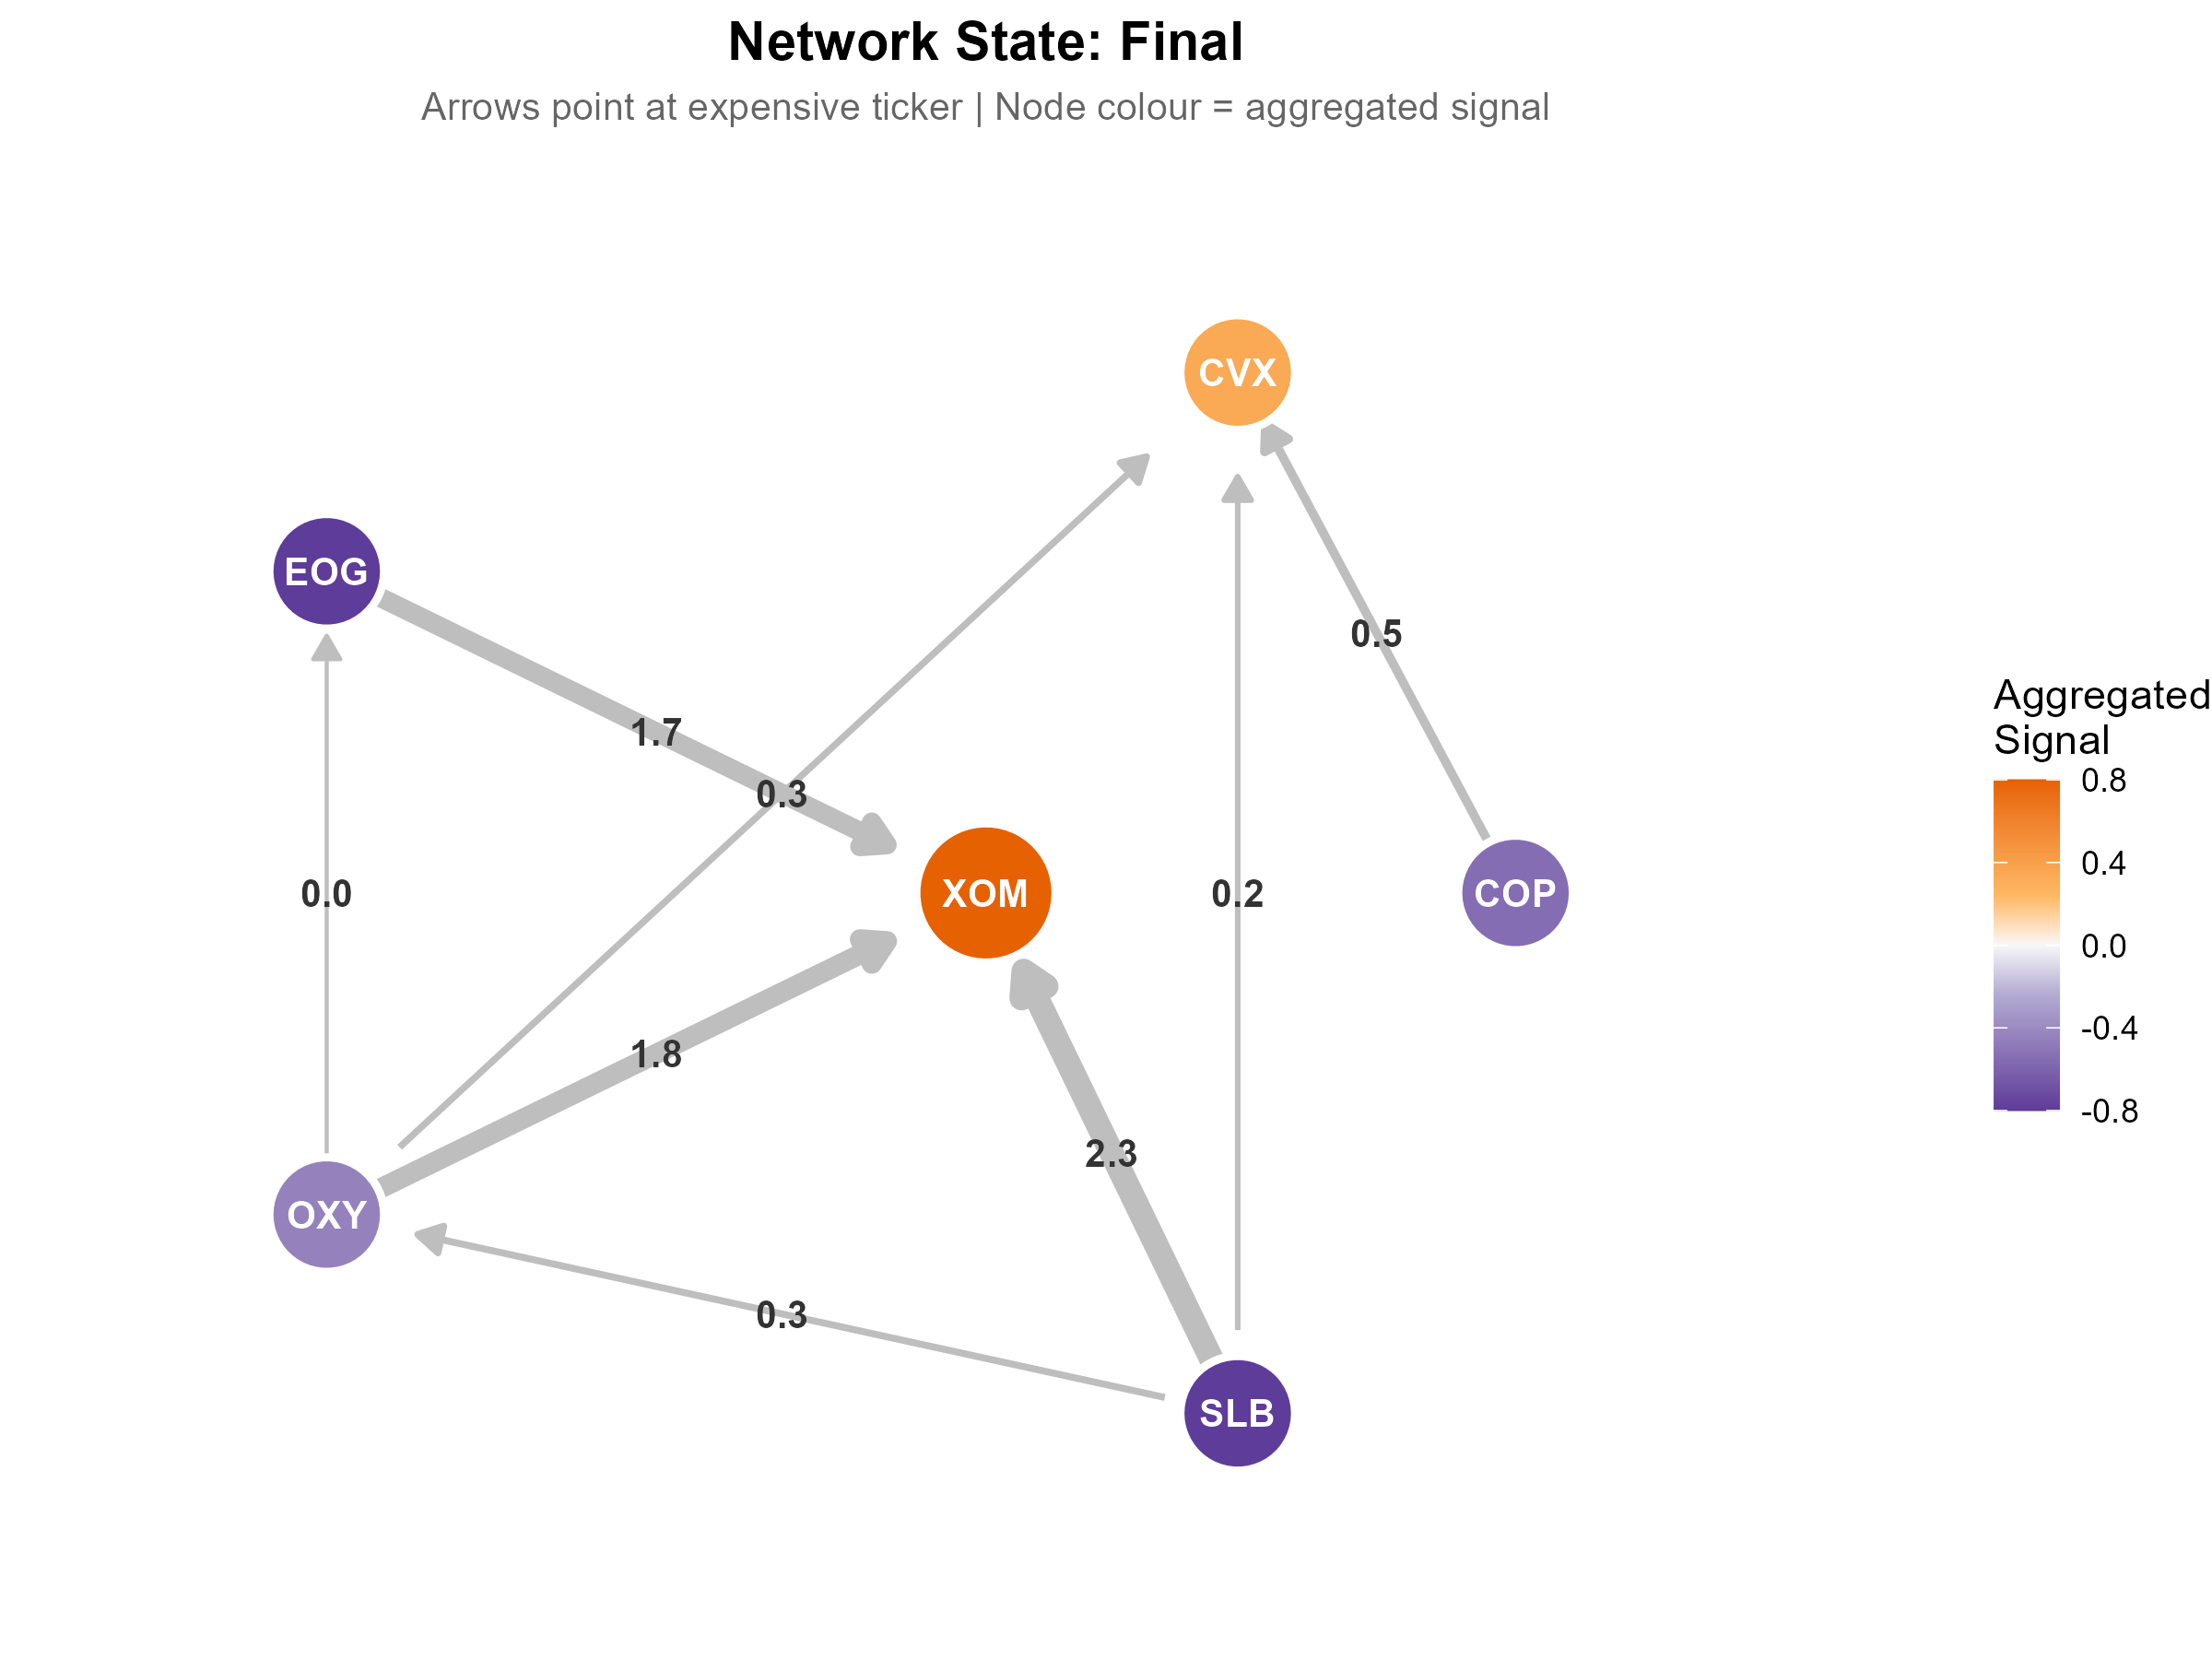
Translating this spatial concept to financial markets involves viewing individual asset spreads as bearings. Each spread acts as a market participant casting a vote on relative value, signaling whether a specific ticker appears rich or cheap relative to another. For instance, evaluating ExxonMobil (XOM) against a basket of energy sector peers might reveal that multiple pairwise spreads involving XOM are statistically stretched, while spreads excluding XOM hover near zero.
While a single divergent spread offers limited and potentially misleading information—as the movement could stem from the counterpart asset rather than the target—an overlapping network of spreads provides high-conviction clustering. When three distinct spreads simultaneously indicate that an asset is expensive, the network yields a clear directional fix. Nevertheless, financial markets differ fundamentally from physical geography; a quantitative fix reveals where a network of overlapping spreads is pointing, but it does not inherently guarantee the underlying cause of the dislocation.
Scaling from Pairs to Portfolio Networks
The true power of triangulated statistical arbitrage materializes when scaling the methodology from a handful of isolated pairs to a broad asset universe comprising 40, 60, or 100 interconnected equities. Traditional pairs trading forces practitioners to manage a collection of independent binary relationships, often resulting in redundant or counterproductive hedging.
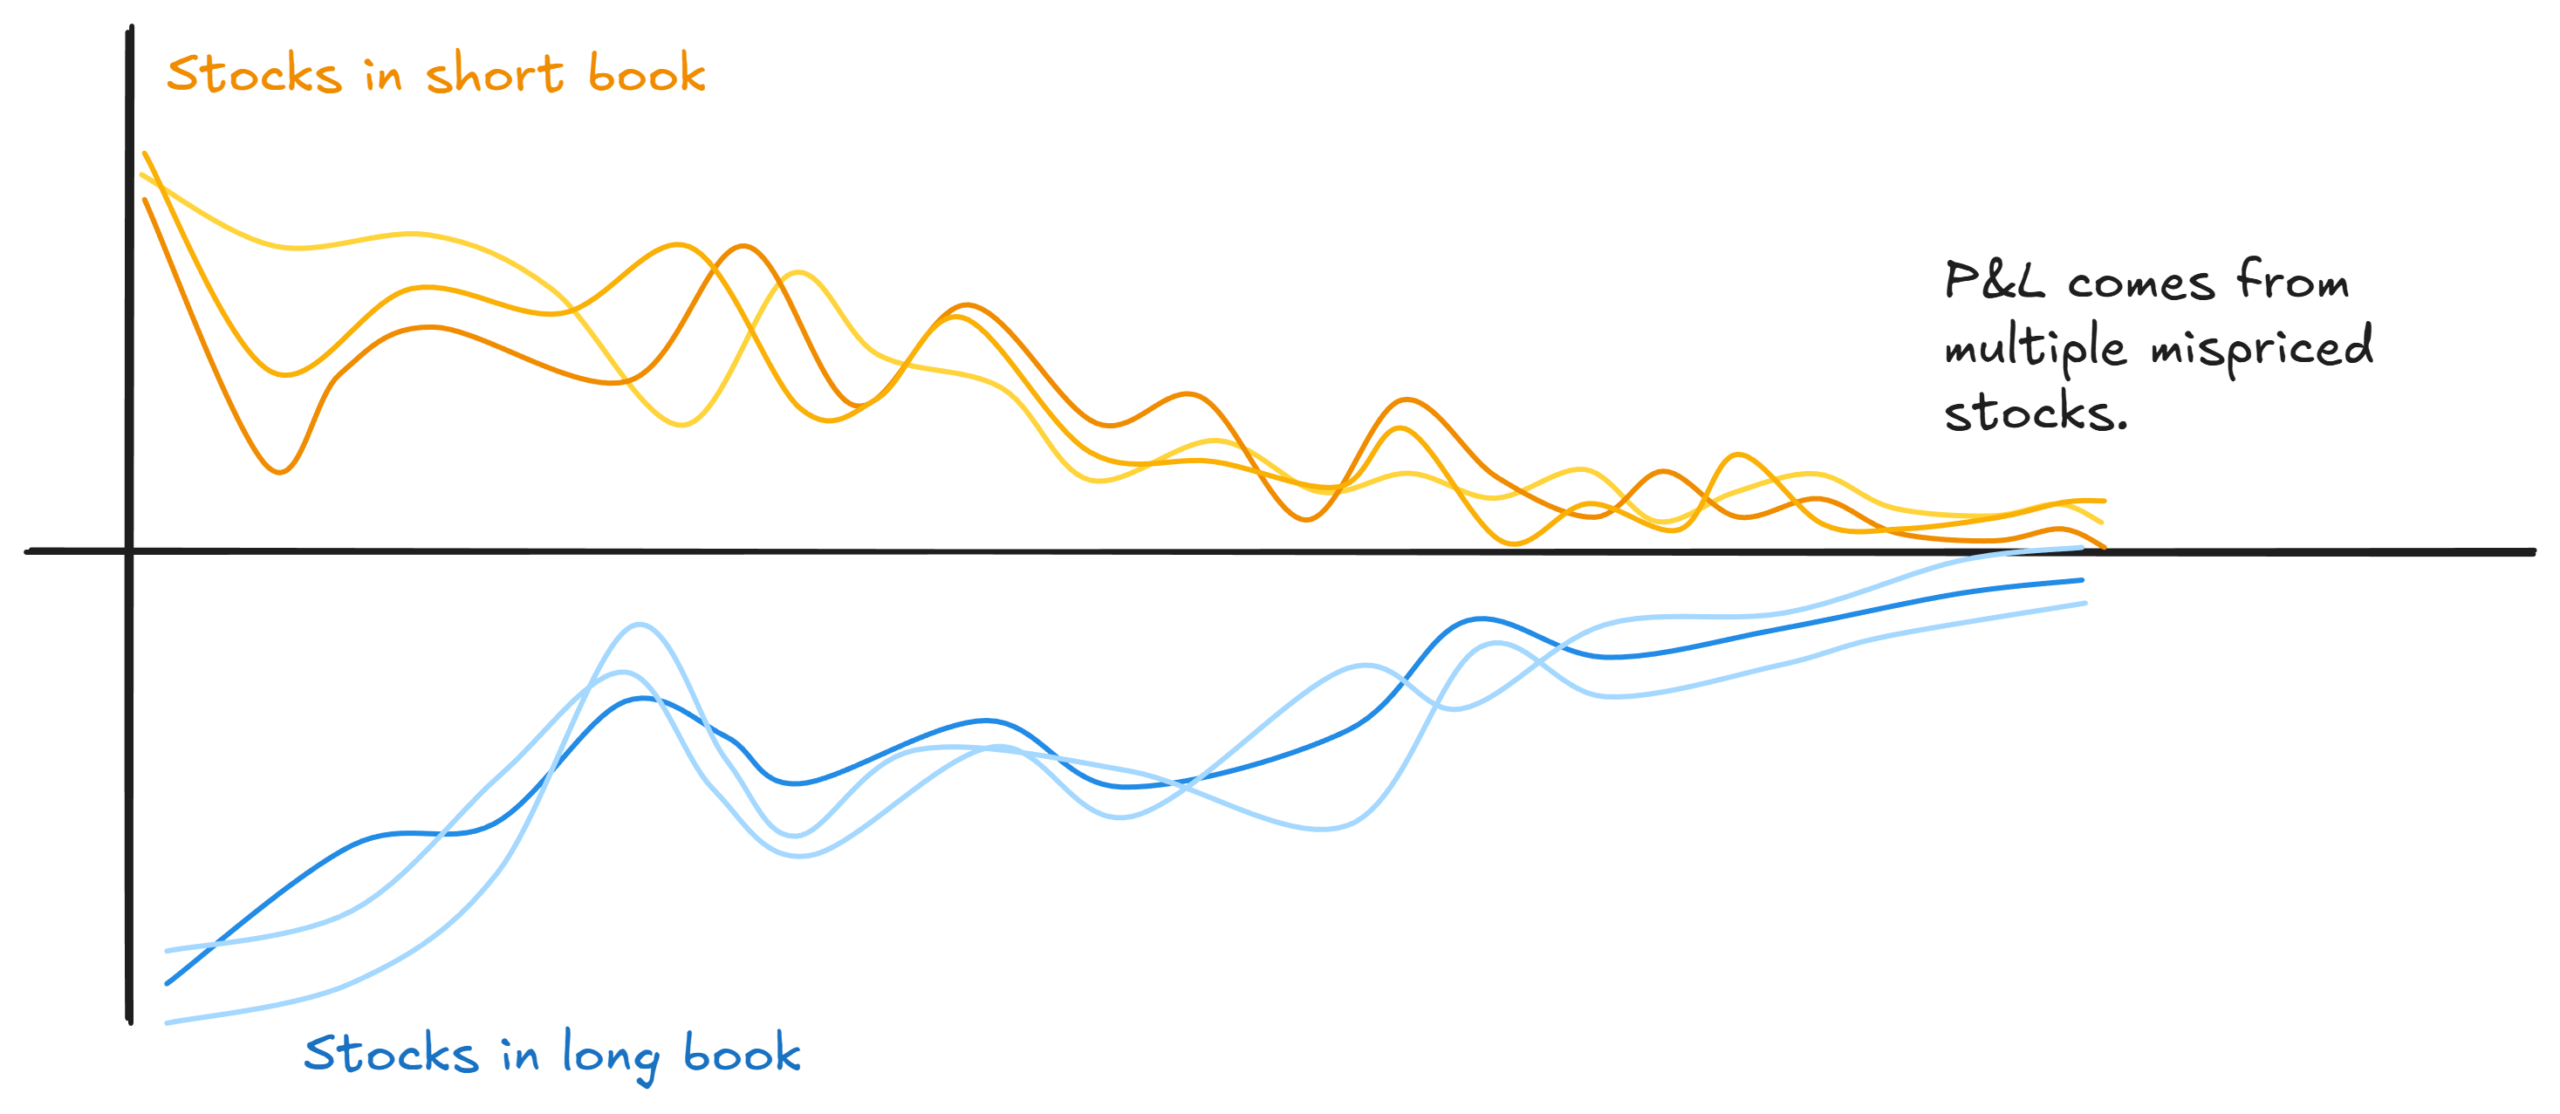
By applying triangulation across an entire network of overlapping spreads, quantitative traders can transition from identifying isolated outliers to constructing a cohesive, multi-leg long-short portfolio. In this framework, the long book is populated by equities that the network identifies as undervalued relative to their collective peers, while the short book absorbs assets flagged as overvalued. Every individual position is specifically targeted toward exploiting an apparent market mispricing, optimizing capital efficiency and harnessing the law of large numbers far more rapidly than conventional pairs trading allows.
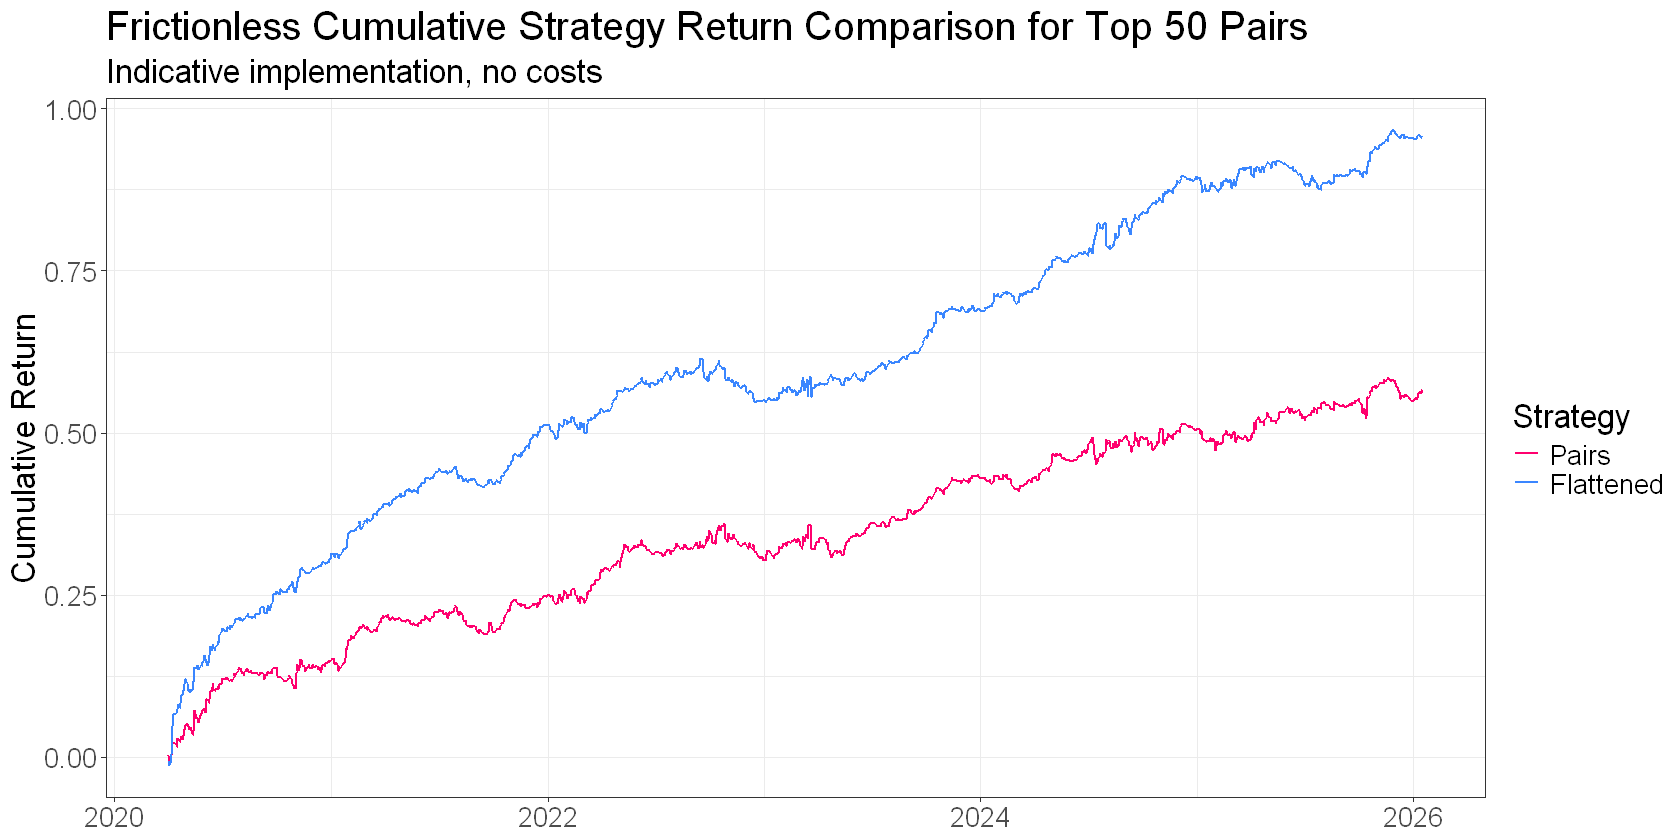
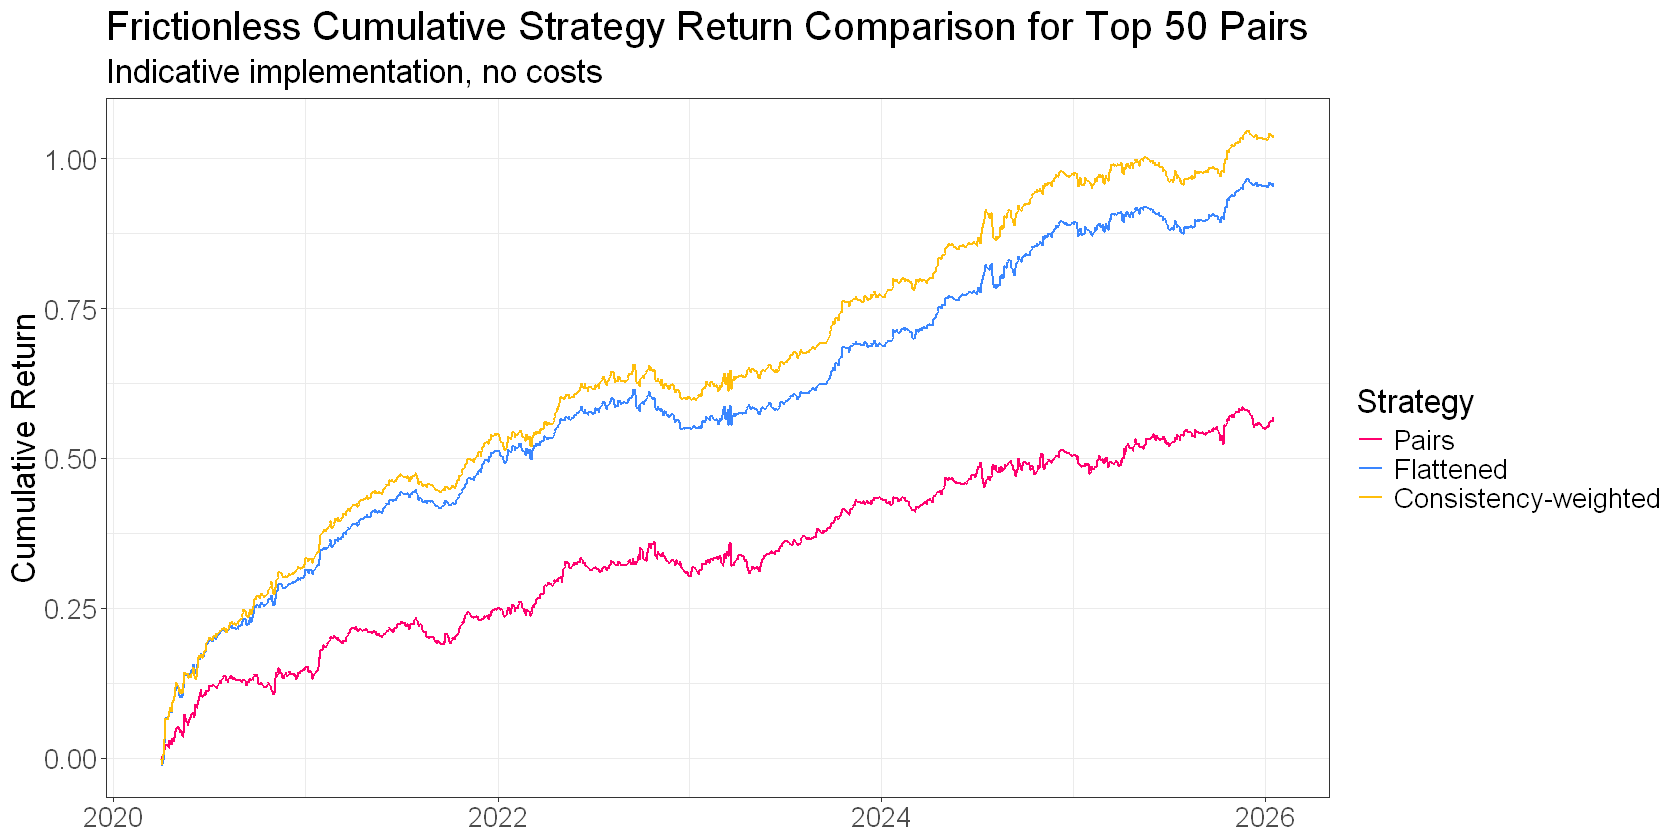
Empirical observations from quantitative research indicate that a significant portion of this performance enhancement is achieved simply through the network aggregation—or "flattening"—step. Genuinely mispriced securities consistently manifest as anomalies across multiple concurrent relationships, allowing random noise to wash out organically.
Refining Signals via Network Consistency
To elevate the efficacy of flattened portfolio signals beyond baseline statistical averages, quantitative analysts implement metrics designed to measure the degree of consensus within the network. One such metric is consistency, which evaluates the absolute value of the mean sign of accumulated votes for a given ticker.
When individual signals are normalized to directional integers (+1 or -1) and averaged, a high consistency score indicates that the broader network of spreads points uniformly toward a specific asset being mispriced. Conversely, low consistency denotes conflicting signals across different pairwise relationships, signaling that the observed dislocation is likely noise or driven by the asset’s counterpart. By weighting portfolio allocations based on consistency, traders can systematically discount ambiguous signals and concentrate capital on cleaner, high-conviction opportunities.
Distinguishing Structural Mispricing from Fundamental Repricing
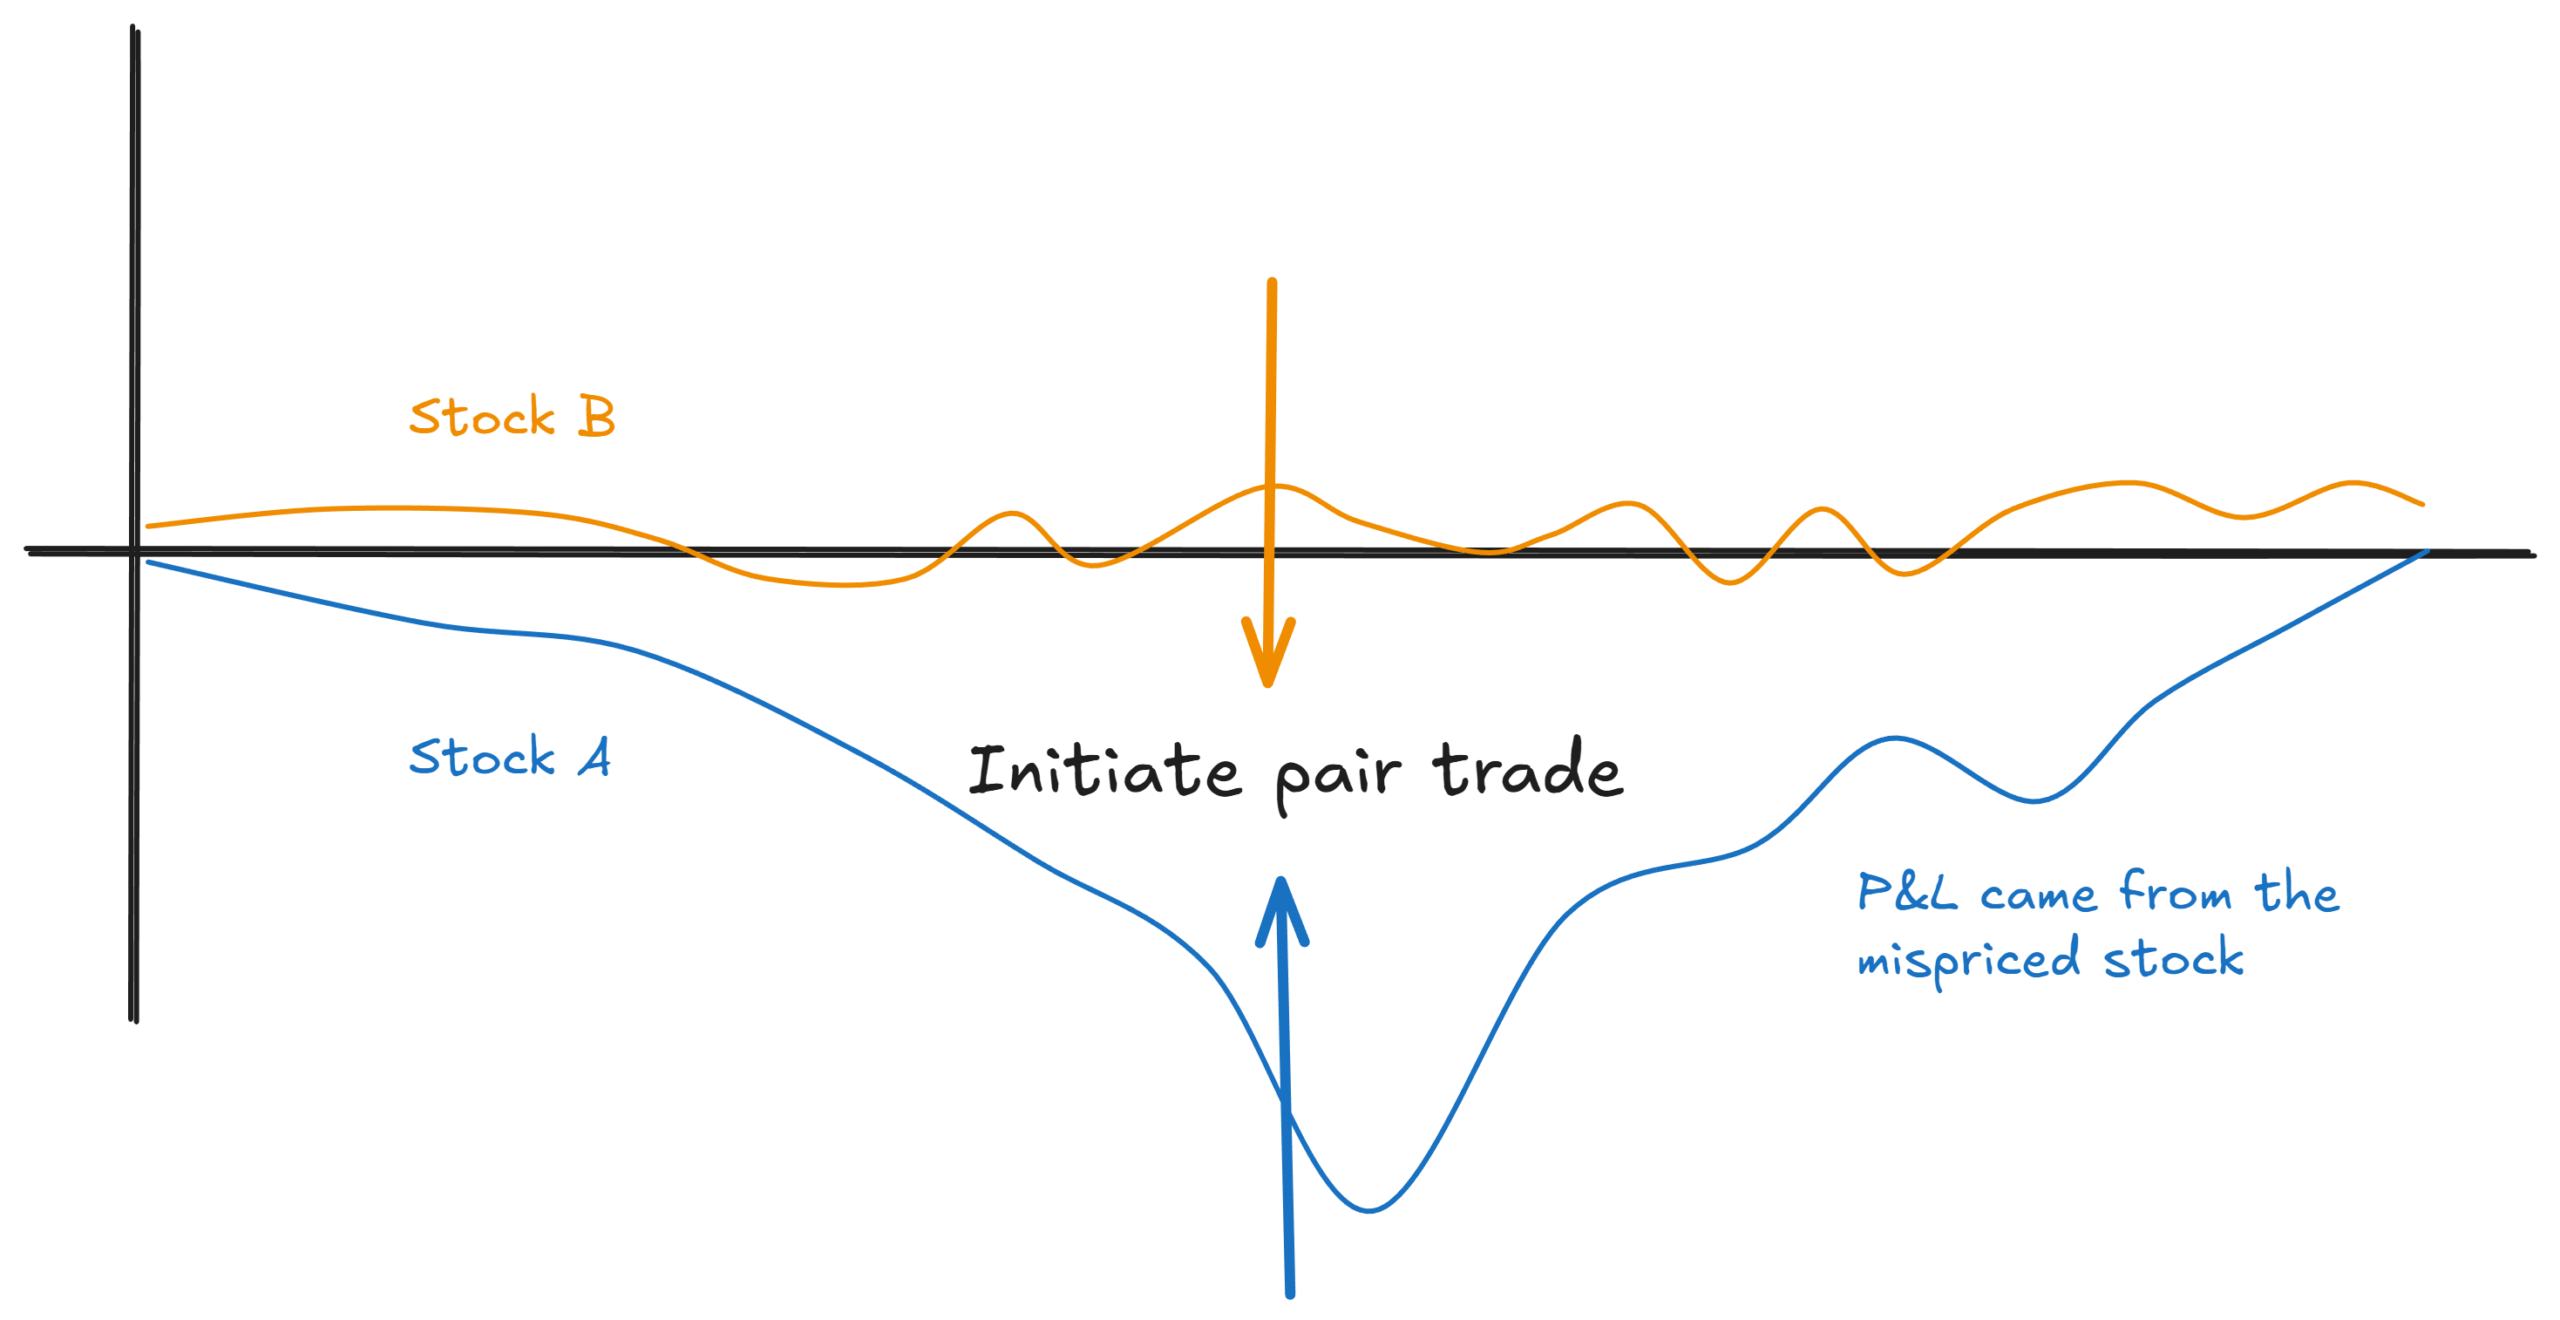
A central challenge in statistical arbitrage lies in differentiating between temporary price-insensitive flows and permanent fundamental repricing. When an asset like XOM appears as an outlier within a triangulated network, its z-score dislocation could be the result of transient liquidity imbalances—such as a large institutional fund rebalancing its sector exposure or algorithmic hedging flows working through the order book. These temporary divergences inherently present profitable mean-reversion opportunities.
Alternatively, an asset may diverge due to genuine, information-driven news events, such as unexpected earnings reports, production revisions, or regulatory developments. In such scenarios, the asset’s new price level reflects fundamental reality rather than market mispricing, rendering mean-reversion strategies unprofitable and exposing traders to adverse selection risk.
While standard z-scores and network triangulation successfully highlight structural anomalies, they cannot independently determine whether a network’s directional fix is fundamentally justified. To mitigate this risk, advanced trading frameworks incorporate auxiliary data streams, including volume dynamics, idiosyncratic news sentiment, and earnings surprise metrics. Research indicates that the behavioral patterns of trading activity differ noticeably during liquidity-driven dislocations compared to information-driven repricings, providing a quantitative basis for filtering out false signals.
Alternative Mathematical Formulations and Regression Factors
Further sophistication can be introduced into triangulated statistical arbitrage by framing spread z-scores as linear combinations of individual ticker alphas. By defining pairwise spread z-scores ($z_AB = alpha_A – alpha_B$), quantitative researchers can formulate simultaneous equations to infer underlying asset-level alphas from observed market data.
Executing a standard ordinary least squares (OLS) regression minimizes the sum of squared alphas, distributing the signal across the entire asset universe. However, modern implementations frequently utilize regularized regression techniques, such as Ridge regression (which shrinks coefficients toward zero) or Lasso regression (which forces irrelevant coefficients entirely to zero). These advanced methodologies allow traders to concentrate alpha signals into a minimal subset of actionable tickers, thereby reducing portfolio turnover and transaction friction.
Comparative Analysis of Quantitative Factors
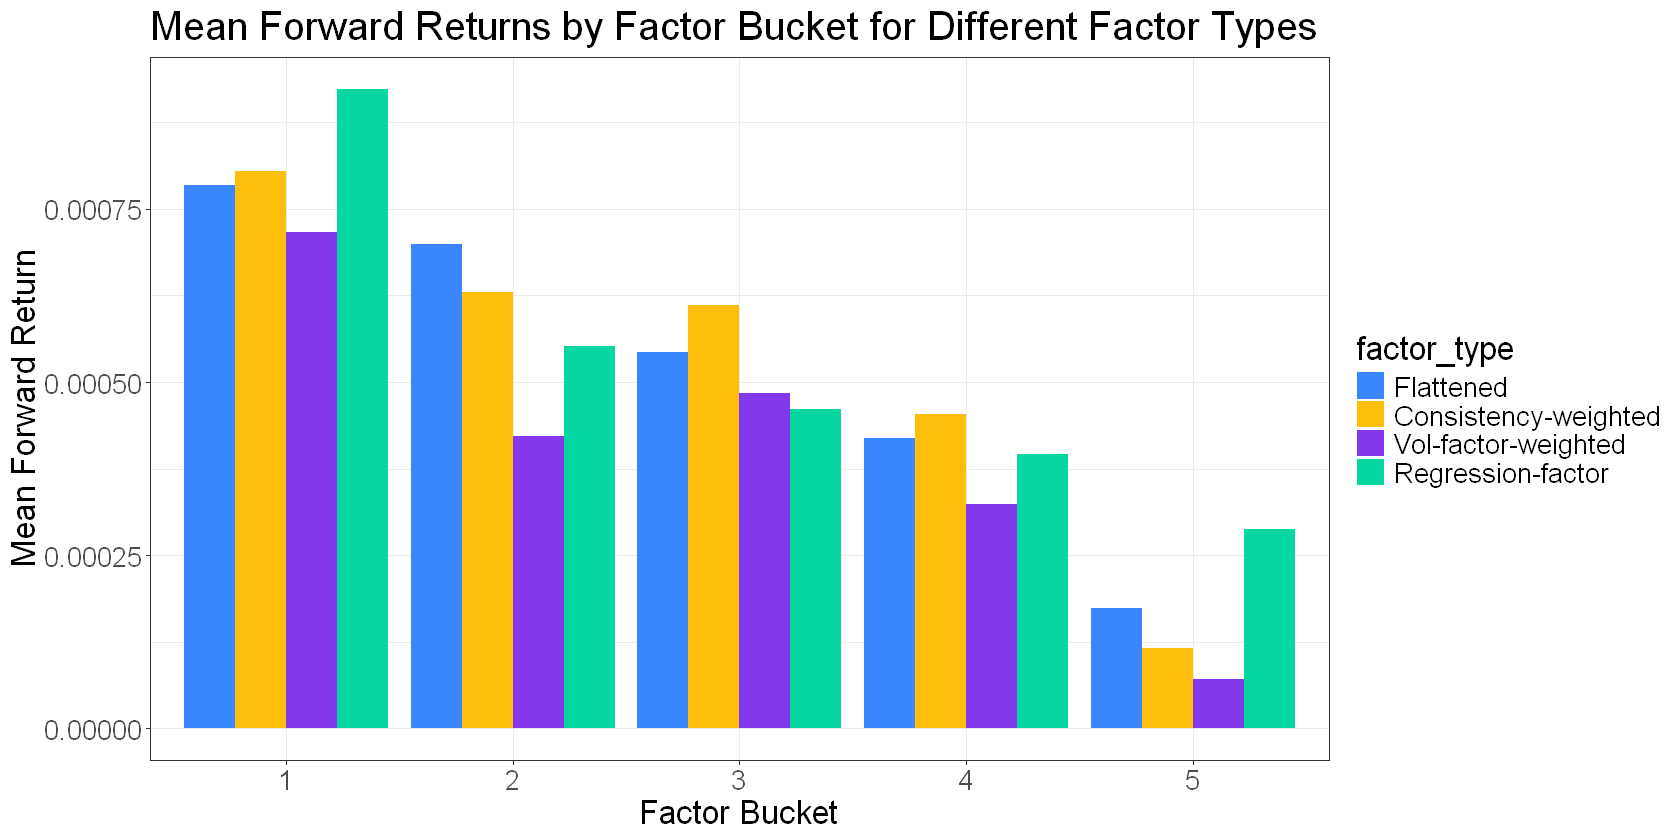
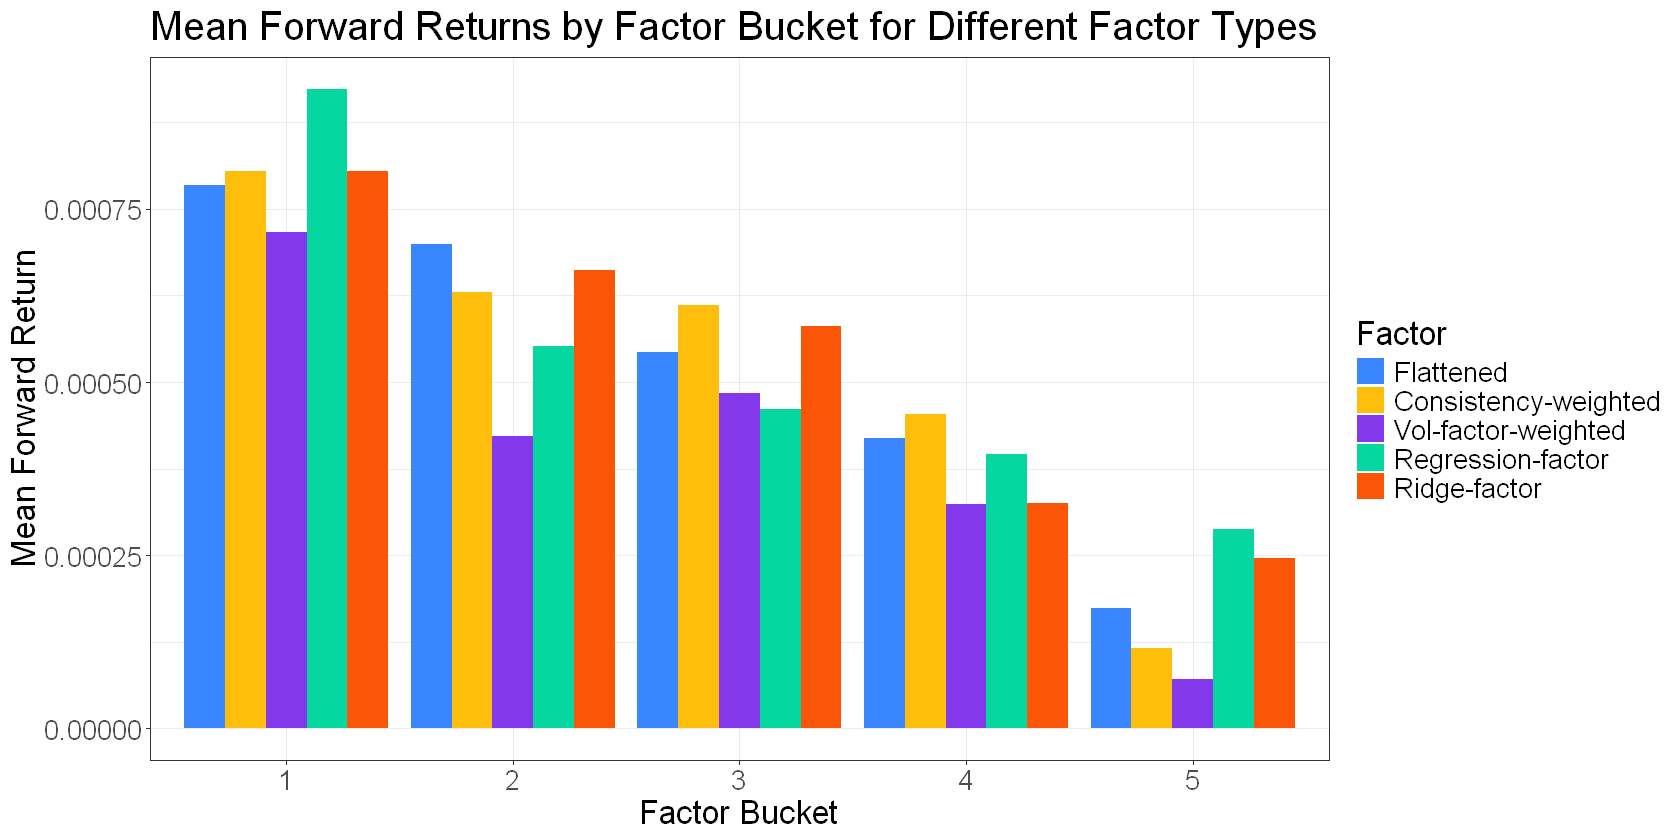
Evaluating the cumulative performance of network-derived factors reveals distinct operational trade-offs across different quantitative implementations. While basic flattening techniques deliver the largest marginal performance improvement over traditional pairs trading, subsequent enhancements—such as consistency weighting, ridge regression factors, and volume-based filters—offer nuanced optimization of risk-adjusted returns.
Higher-complexity factors often introduce increased portfolio turnover and faster signal decay, requiring traders to carefully balance theoretical alpha gains against real-world execution costs. Empirical backtests across rolling equity universes consistently demonstrate that while advanced regression and filtering techniques refine execution, the fundamental architecture of transitioning from isolated pairs to a triangulated portfolio network remains the primary driver of excess return.
Broader Industry Implications and Future Outlook
The transition toward network-based statistical arbitrage reflects a broader evolution within systematic asset management. As markets become increasingly saturated and traditional quantitative anomalies face capacity constraints, independent traders and institutional funds alike are compelled to adopt more holistic, network-centric portfolio structures.
The methodology underscores a clear tripartite framework for modern statistical arbitrage: first, establishing a robust selection pipeline to identify high-quality pairs; second, deploying network triangulation and consistency weighting to construct an efficient multi-leg portfolio; and third, integrating volume and news analytics to filter out permanent fundamental repricings. While mastering all three components demands significant computational and analytical resources, the resulting improvements in capital efficiency and risk-adjusted performance substantiate the shift away from legacy pairs trading models. As quantitative tooling continues to evolve, network-based statistical arbitrage is poised to remain a cornerstone strategy for independent traders navigating complex, interconnected equity markets.
Related posts: