Statistical Arbitrage for Independent Traders: A Deep Dive into Triangulated Stat Arb

Statistical arbitrage, often abbreviated as stat arb, fundamentally operates on the principle of mean reversion. At its core, it involves identifying two related financial instruments that have temporarily diverged from their historical price relationship and betting on their eventual convergence. While pairs trading is the most recognized manifestation of this strategy, its inherent inefficiencies, particularly regarding capital allocation and signal utilization, can be a significant hurdle for individual traders. This article delves into the sophisticated "Triangulated Stat Arb" methodology, a refined approach designed to overcome these limitations by constructing a robust universe of high-quality trading pairs, transforming these relationships into ticker-centric views, and aggregating insights across multiple pairs to pinpoint mispriced individual securities. The ultimate goal is to trade a diversified portfolio of tickers rather than isolated pairs, optimizing capital deployment and enhancing signal strength.
The foundation of this advanced statistical arbitrage strategy rests upon three critical pillars, as previously outlined in discussions on "When is a Mispricing Not a Mispricing?". These pillars are: the rigorous selection of fundamentally sound trading pairs, the implementation of triangulation and consistency metrics to extract maximum value from these pairs while discarding noise, and the incorporation of external data such as volume, news, and event-driven factors to mitigate the risk of trading non-converging divergences. This article aims to provide a comprehensive overview of how these three components are meticulously resourced and integrated to create a powerful and efficient trading system.
It is crucial to note that while the underlying methodology is universally applicable, specific implementation details—such as precise filters, scoring weights, and cutoff thresholds—are operational choices tailored to individual trading objectives and constraints. The broader strategic framework, however, offers a generalizable blueprint for identifying and capitalizing on mispricings. Furthermore, this analysis highlights the hierarchical importance of each component, emphasizing that not all elements contribute equally to overall performance. Understanding this hierarchy is vital for independent traders seeking to optimize their resource allocation and operational overhead. This detailed exploration draws from several months of live trading experience with the production version of the Triangulated Stat Arb strategy.
The Bedrock: Cultivating a Universe of High-Quality Pairs
The efficacy of any statistical arbitrage strategy hinges critically on the quality of the underlying asset universe. If the selected pairs are fundamentally flawed, no subsequent analytical refinement can salvage the strategy’s profitability. Conversely, a meticulously curated universe of robust pairs forms the bedrock upon which all subsequent value-adding processes are built.
Within the Triangulated Stat Arb framework, two key metrics are employed to define the quality of a trading pair. The first metric quantifies the potential for profitable mean reversion within the chosen lookback window, assuming frictionless trading conditions. It assesses whether buying the relatively undervalued asset and simultaneously selling the overvalued one would have generated positive returns. Pairs exhibiting a low or negative "reversion-factor score" indicate a tendency to diverge and remain diverged, rendering them unsuitable for this strategy.
The second metric evaluates the consistency of the spread’s convergence after it has diverged. It differentiates between spreads that diverge for the entirety of a formation period and then coincidentally converge at the very end, versus those that demonstrate a reliable tendency to revert to their mean following a divergence.
By combining these two metrics, a potent filter emerges, capable of identifying pairs that reliably exhibit the desired behavior: a tendency to drift apart and subsequently reconverge with sufficient magnitude and frequency to facilitate profitable trades. This direct measurement of desired characteristics bypasses the often-opaque interpretations of traditional statistical tests like cointegration, offering a more pragmatic and actionable assessment. Further insights into this approach can be found in the article "Moneyball—Finding Undervalued Pairs Using Unconventional Metrics."
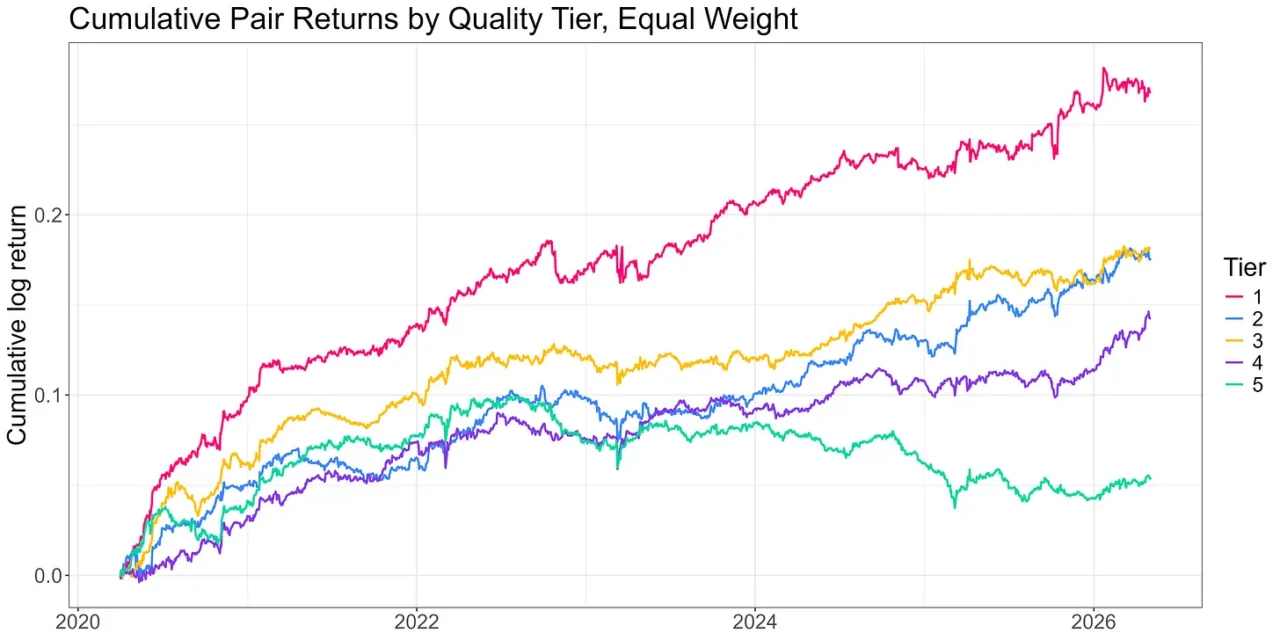
Typically, the top 10% of pairs, as ranked by this system, are selected for further consideration, provided they exhibit economic sensibility and are broadly exposed to similar risk factors. This selection process is conducted monthly, utilizing the preceding 24 months of historical data. Within this top decile, pairs are further categorized into five distinct tiers. The performance of a simple pairs trading strategy, before accounting for trading costs, on each tier, using equal weighting, illustrates the effectiveness of the ranking system.

(Image Placeholder: A chart showing cost-free returns to trading a simple pairs strategy across five tiers of pair quality, with Tier 1 showing the highest returns and Tier 5 the lowest.)
The data consistently demonstrates that the ranking system effectively discriminates between high- and low-performing pairs. Tier 1 pairs emerge as the clear leaders, while the middle tiers exhibit a more mixed but generally strong performance. Tier 5 pairs, conversely, are demonstrably inferior.
Quantifying the risk-adjusted returns for each tier further underscores the system’s efficacy:
- Tier 1: High Sharpe Ratio, Significant Alpha
- Tier 2: Strong Sharpe Ratio, Moderate Alpha
- Tier 3: Moderate Sharpe Ratio, Modest Alpha
- Tier 4: Lower Sharpe Ratio, Minimal Alpha
- Tier 5: Negative Sharpe Ratio, Negative Alpha
This analysis reveals approximately a fourfold difference in Sharpe ratios between the top and bottom tiers. While the intermediate tiers show some variability, they generally offer robust performance in terms of risk-adjusted returns, albeit with lower absolute total returns—a known limitation of traditional pairs trading that Triangulated Stat Arb aims to address.
The impact of this foundational pair selection process is profound, dwarfing any incremental gains that might be derived from downstream signal-generating activities. The quality of the pair universe fundamentally dictates the potential alpha capture throughout the entire pipeline.
While the process of generating and refreshing the pair universe involves numerous subtle considerations, including liquidity filters, industry constraints, data refresh cadences, and the management of delistings and corporate actions, the primary value creation lies in the painstaking, long-term effort of producing a clean, ranked, and economically sensible pair universe. This methodical upstream work, demanding significantly more intellectual rigor than superficial cointegration testing, is the true engine of alpha generation in this strategy. The majority of the potential profit embedded within the broader pipeline is effectively determined at this initial stage.
Triangulation and Consistency: Elevating Ticker-Level Insights
Once a high-quality universe of trading pairs has been established, the strategic focus shifts from individual pairs to individual tickers. This transition, facilitated by the triangulation and consistency methodology, is crucial for overcoming the inherent capital inefficiencies and signal wastage associated with traditional pairs trading, particularly for solo operators. The detailed methodology behind this transformation is elaborated in "The Metamorphosis."
The core idea is to leverage each ticker’s participation in multiple pairs. For every ticker within the universe, its involvement in various pairs provides a unique per-ticker perspective. Each pair contributes a view of the ticker’s relative valuation, expressed as a z-score indicating the deviation of the spread from its rolling mean. By aggregating these per-ticker views across all pairs a given ticker belongs to, a composite signal emerges. This aggregated view, representing a convergence of insights from multiple relationships, forms the basis for trading decisions.
When executed effectively, this network-based signal offers a substantial improvement over standalone pairs trades. A consensus among multiple pairs regarding a ticker’s mispricing provides a significantly stronger conviction than any single pair could offer. However, a naive implementation can dilute this power. Two common pitfalls include:
- Over-reliance on Pair-Level Signals: Simply averaging z-scores across pairs without considering the underlying strength or consistency of each pair’s signal.
- Ignoring Correlation Structures: Failing to account for the fact that pairs may be highly correlated, leading to redundant signals and an illusion of diversification.
A critical operational decision involves determining how to act upon the ticker-level signal. The signal’s most informative power resides in its extreme values. The central portion of the distribution typically reflects noise rather than robust mispricing. By focusing trading activity on these extremes, rather than every ticker exhibiting a signal, the overall results can be materially enhanced. This approach mirrors the practice in pairs trading of avoiding trades when the z-score is close to zero, such as 0.5.
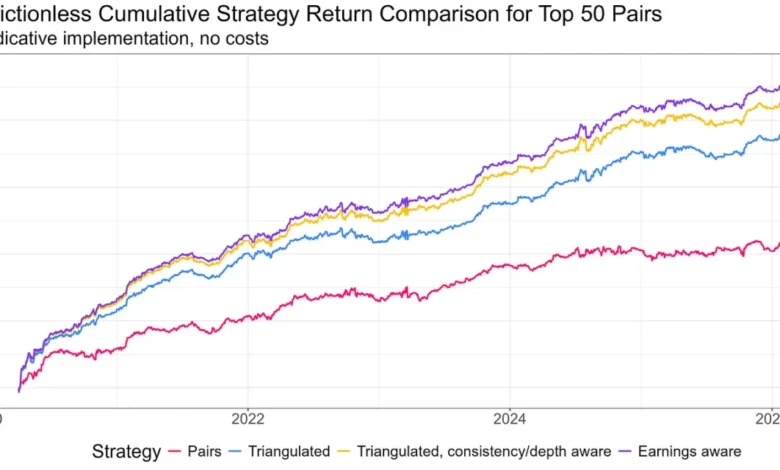
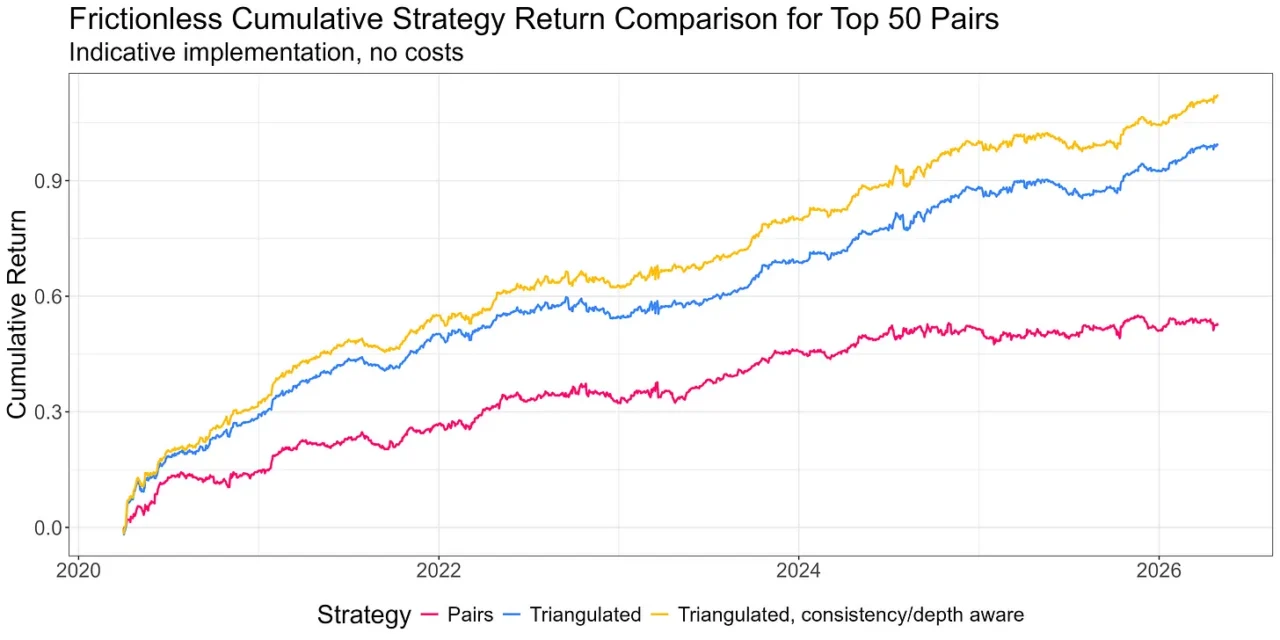
The following illustration depicts the cost-free returns of various portfolio construction approaches, starting with a simple portfolio of the top 50 pairs, then progressing to a triangulated long-short portfolio of mispriced legs, and finally incorporating depth and consistency considerations.
(Image Placeholder: A chart comparing the returns of trading a portfolio of top 50 pairs, trading them as a triangulated long-short portfolio of mispriced legs, and then including depth and consistency metrics.)
The data indicates that a portfolio constructed from mispriced ticker legs significantly outperforms trading individual pairs. Further refinement by incorporating consistency and depth metrics yields additional performance gains. Crucially, this approach offers vastly improved capital efficiency for individual traders.
Navigating Market Nuances: The Role of External Data
While the Triangulated Stat Arb signal effectively identifies potential mispricings, it does not inherently explain the reasons behind a spread’s divergence. A signal indicating "short the expensive leg" could arise from various scenarios. For instance, the expensive leg might have surged due to transient forced selling pressure that is likely to reverse, presenting a favorable trading opportunity. Conversely, the same upward movement could be driven by genuine new information that has fundamentally repriced the stock, making a short position ill-advised. Distinguishing between these scenarios is the critical function of the third pillar: incorporating external data.
The primary sources for this crucial distinction are volume, news, and event-driven data. Each of these categories can offer valuable clues as to whether a divergence is purely technical and thus "fadeable," or fundamentally driven and therefore best avoided.
Initial research into volume data yielded mixed results. While an intuition existed that asymmetry in volume could signal differences between forced selling on the cheap leg and informed buying on the expensive leg, the observed effect at the pair level diminished significantly when integrated into the production strategy. Much of what volume data seemed to indicate was already captured by the upstream pair-quality assessment. A deeper analysis revealed that the aggregation process from pairs to tickers obscured the nuanced volume signals. Consequently, volume-based features are not currently part of the live strategy. However, for traders employing a pure pairs trading approach, volume features could still hold significant value.
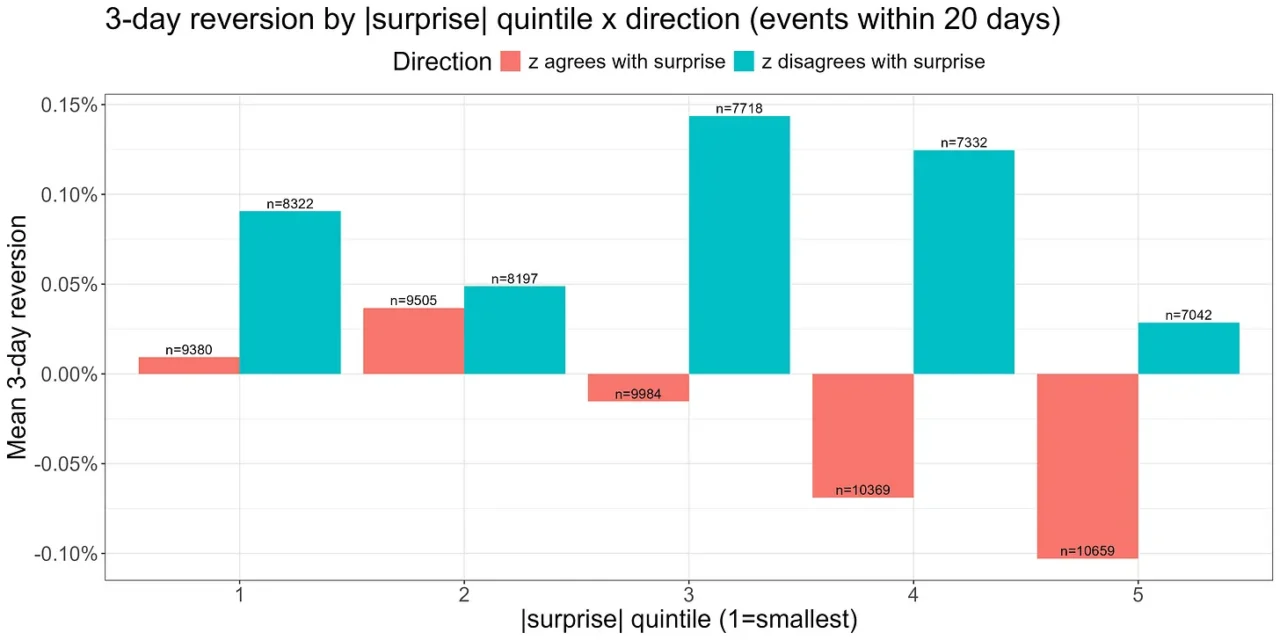
The most impactful discovery in this area has come from an earnings filter. When a significant earnings surprise occurs during a spread’s formation period, the spread often appears stretched in the direction of the surprise. However, the stock movement in such instances is typically driven by substantive new information, rendering it a fundamental repricing rather than a temporary anomaly. Consequently, fading such moves is generally inadvisable. This mechanism is both logically sound and empirically supported by the data, providing a small but meaningful enhancement to the live strategy.
The accompanying chart illustrates the three-day reversion performance (measured by three-day forward returns, signed by the negative of the z-score) when an earnings surprise occurred during the z-score’s formation period. When the z-score divergence aligns with the direction of the earnings surprise (indicated by red bars), there is a demonstrably lower tendency for reversion. For substantial surprises, the data even shows a trend towards continuation, a phenomenon often referred to as post-earnings drift.
(Image Placeholder: A bar chart showing the average three-day reversion for different magnitudes of earnings surprises, illustrating reduced reversion when the surprise aligns with the spread divergence.)
The integration of an earnings filter into the trading strategy has demonstrated a positive impact on performance.
(Image Placeholder: A chart comparing the returns of the strategy with and without the earnings filter applied.)
Broader news analysis represents the next frontier in refining this third pillar. The principle that drove the success of the earnings filter—identifying events that represent genuine fundamental repricing—is expected to generalize. Any surprising event that causes a significant price movement in one leg of a spread based on truly novel information is likely to undermine the mean-reversion thesis.
While the third piece of the methodology demonstrably adds value, its marginal contribution is smaller than initially anticipated. This is largely attributable to the robust performance of the upstream pair-quality assessment, which accounts for the majority of the potential alpha. The pattern observed is one of diminishing returns: each successive refinement yields progressively smaller incremental gains. Pair selection remains the paramount determinant of the strategy’s overall success or failure.
Resourcing the Strategy: Infrastructure and Community
The realization of the Triangulated Stat Arb methodology is contingent upon robust operational infrastructure and a supportive community. The Robot Wealth Pro (RW Pro) platform provides an API that delivers end-of-day and intraday spread data essential for live trading, alongside historical feeds crucial for ongoing research and development.
The upstream pipeline responsible for generating the monthly pair universe is a substantial undertaking in itself. Compiling a universe from thousands of candidate stocks necessitates extensive data ingestion, rigorous cleaning processes, and computationally intensive ranking calculations across hundreds of thousands of potential pairs. The data and computational resources alone represent a significant investment, far exceeding the annual cost of an RW Pro subscription, not to mention the substantial engineering effort required for building and maintaining such infrastructure. This foundational work has been completed and is made available to the community.
The data infrastructure serves not only for live trading but also for in-depth research and exploration. The RW Pro research environment houses the comprehensive historical datasets upon which the methodology was developed, enabling members to investigate any aspect of the data and test their own hypotheses. Whether exploring new criteria for "good" pairs, developing additional features for the third pillar, or refining signal construction techniques, the data is readily accessible.
A key component of the RW Pro offering is an example implementation notebook, which has become a surprising source of pride. Recognizing that there is no universal "one-size-fits-all" signal, the platform allows members to customize configurations based on their specific circumstances. This includes parameters such as universe size, weighting schemes, no-trade buffers, signal thresholds, and leverage.
This flexibility is crucial because each trader operates with unique constraints, whether it’s account size, cost structures, risk tolerance, or operational capacity. The RW Pro framework facilitates experimentation and adaptation, fostering a deeper understanding of the strategy’s nuances and ultimately cultivating more independent and skilled traders. The aim is not to provide a rigid solution but to empower traders to navigate trade-offs effectively, much like a seasoned captain navigating their vessel.
The development of this sophisticated strategy has been a collaborative endeavor, unfolding over six months within the RW Pro membership. The community has actively participated, posing questions that have driven the research forward and contributing their own insights, some of which have been integrated into the live strategy. This symbiotic relationship ensures that the work is both rigorous and relevant, benefiting all participants.
Conclusion: The Hierarchy of Returns in Statistical Arbitrage
The complete picture of a properly resourced Triangulated Stat Arb strategy reveals a clear hierarchy of diminishing returns across its core components. The initial selection of high-quality pairs at the universe level accounts for the lion’s share of the potential alpha. The aggregation of insights across multiple pairs through triangulation provides a significant uplift. Further refinement with depth- and consistency-aware filtering offers a smaller but still valuable enhancement, followed by the earnings filter, which contributes an incremental gain. Volume data, while promising, has been parked for now, and news remains an active area for future development.
This pattern underscores a fundamental principle: the earlier and more foundational the analytical step, the greater its impact on overall performance. Pair selection, therefore, is the most critical determinant of the strategy’s success.
The Triangulated Stat Arb approach transforms equity pairs trading into a viable strategy for independent traders. The underlying infrastructure—encompassing the data API, the research environment, example implementations, and a collaborative community—makes this sophisticated methodology accessible without requiring an independent engineering team. For those who have followed this series, the conceptual framework for this powerful statistical arbitrage technique has been laid out. For those seeking to witness this resourced version in action, the door to RW Pro is open.