Decoding Gamma Exposure: How Market Maker Hedging Drives Volatility Regimes and Systematic Trading Strategies

Gamma Exposure (GEX) has quietly transformed from an esoteric derivatives desk metric into one of the most critical structural indicators utilized by systematic quantitative researchers, institutional risk managers, and advanced algorithmic traders. At its core, GEX is a dollar-denominated financial estimate calculating the precise volume of underlying stocks or futures contracts option dealers must proactively buy or sell to maintain delta-neutral positioning as the market fluctuates. Because retail and institutional investors consistently buy more options than they sell, major market makers—such as broker-dealers and specialized options-market-making firms—inevitably absorb the other side of these transactions. To manage the subsequent directional risk, these firms must continuously hedge their aggregate books. The mathematical sign and magnitude of this net gamma exposure ultimately dictate whether dealer hedging practices actively suppress market volatility or dangerously amplify intraday price momentum.
Understanding the Mechanics of Positive and Negative Gamma Regimes
The operational behavior of options dealers can be neatly bifurcated into two distinct structural regimes: positive gamma and negative gamma. In a positive GEX environment, options market makers maintain a net long gamma posture. Consequently, when the underlying index or asset rises in value, dealers are forced to sell stock or futures contracts to rebalance their books back to delta-neutral. Conversely, when the market drops, dealers must buy the underlying asset. This mechanical behavior effectively dampens price action, constricts trading ranges, encourages mean reversion, and frequently causes spot prices to pin tightly near large open-interest option strike prices as expiration approaches. Realized volatility under these conditions historically drops to cyclical lows, creating a favorable backdrop for fading extreme moves, deploying range-bound strategies, and selling option premium.
In sharp contrast, a negative GEX environment occurs when dealers find themselves net short gamma. Under these volatile conditions, market makers are compelled to buy into rising markets (rallies) and sell aggressively into declining markets to maintain their mandated hedges. This pro-cyclical feedback loop drives prices further in the direction of the initial move, accelerating volatility expansion, extending market trends, and triggering wider intraday price swings. Systematic strategy designers quickly learn that deploying a standard breakout rule in a negative gamma regime can yield robust alpha, whereas the exact same rule in a positive gamma environment will likely result in consistent losses. Recognizing these regime shifts bridges the critical gap that price-only technical indicators frequently miss.
Empirical Validation: GEX versus Next-Day Trading Ranges
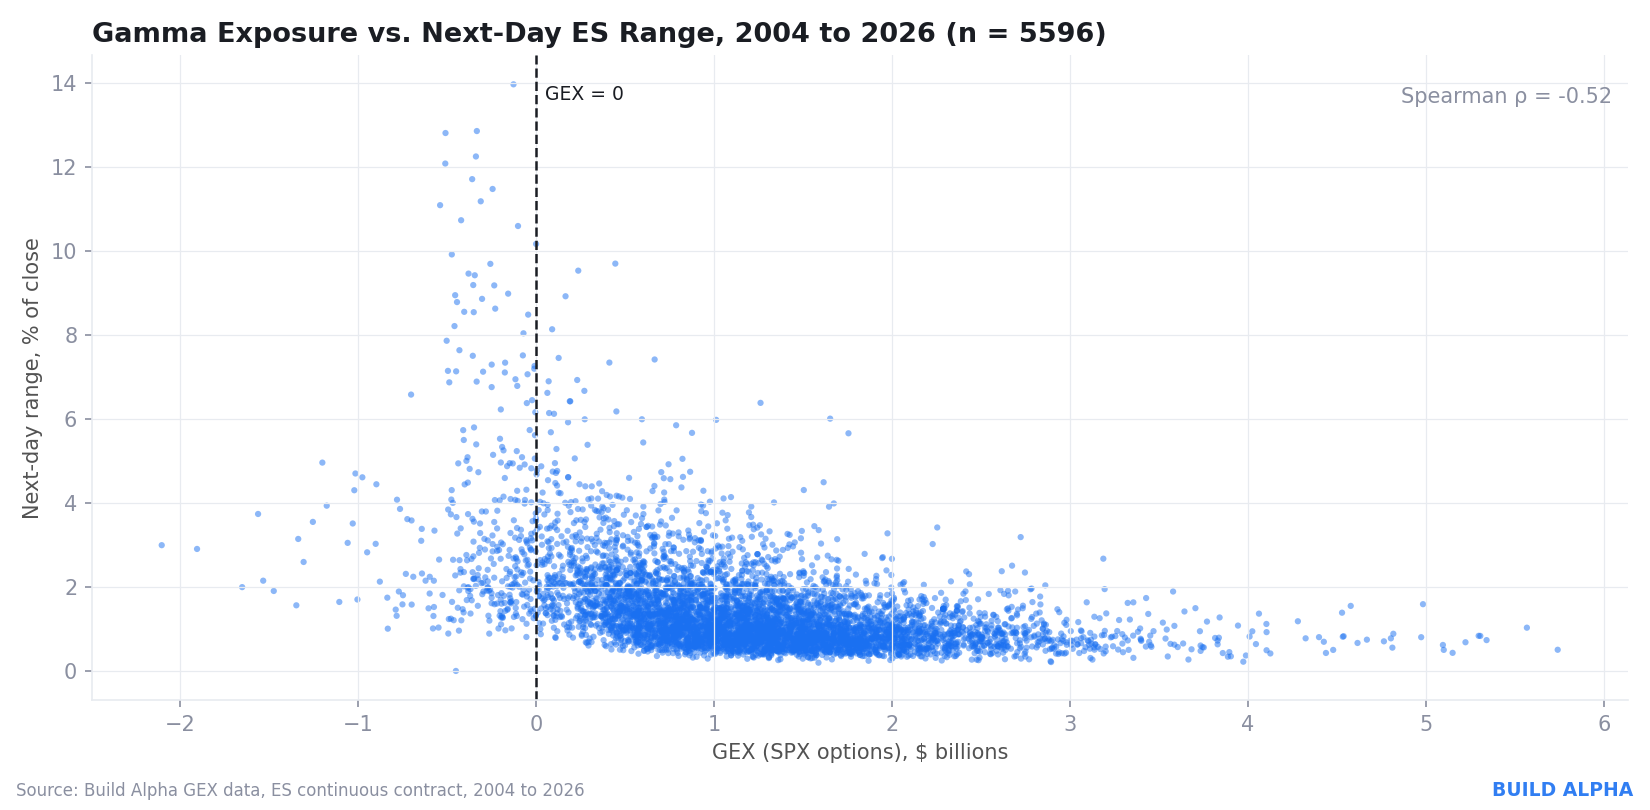
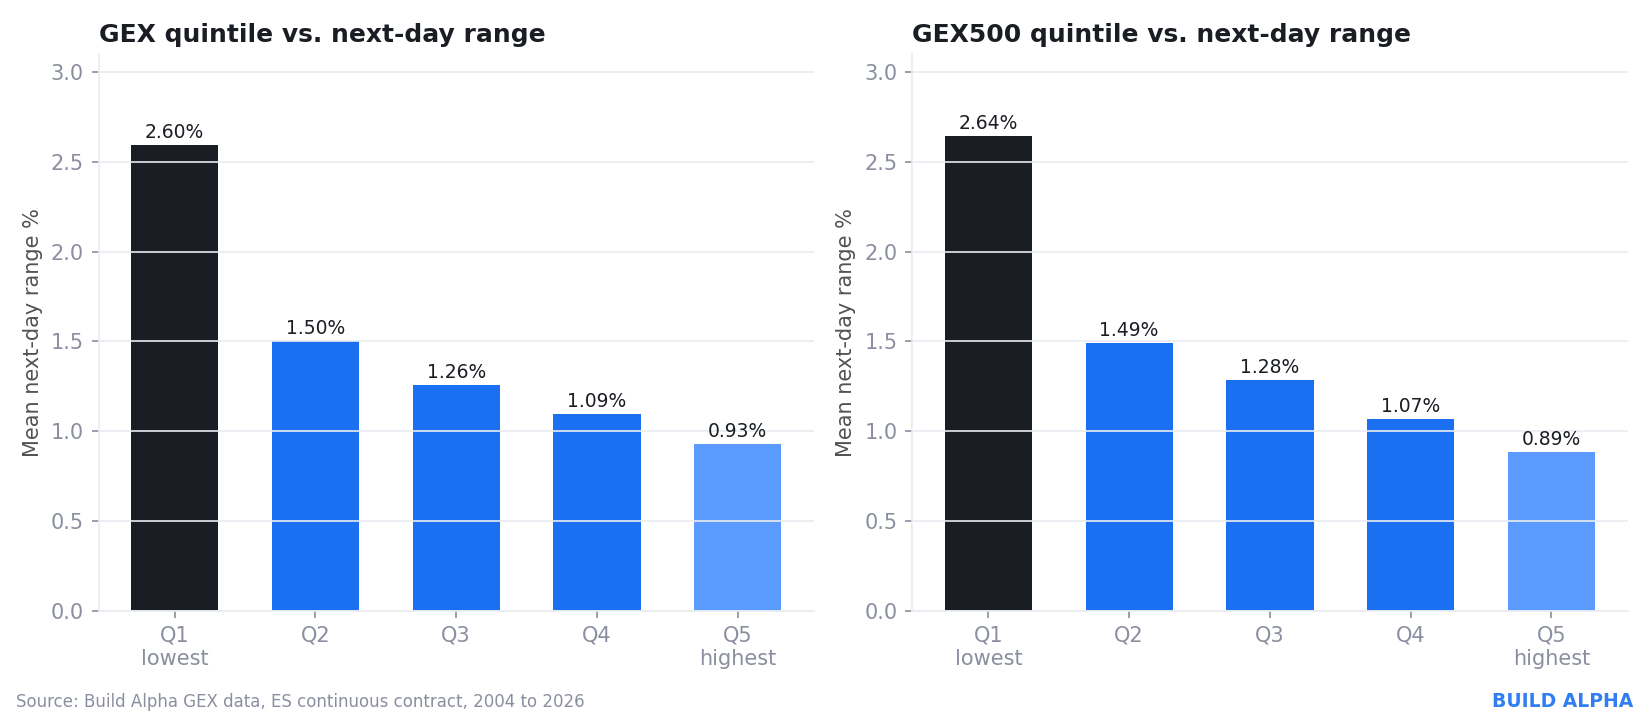
To substantiate the predictive utility of gamma exposure, quantitative studies spanning more than two decades—specifically analyzing daily S&P 500 options data, GEX variants, and E-mini S&P 500 (ES) futures contracts from January 2004 through September 2026—reveal compelling statistical correlations. When examining over 5,500 trading sessions, empirical findings demonstrate that the largest intraday price ranges heavily cluster around negative and extremely low GEX readings.
Sorting historical sessions into distinct GEX quintiles highlights a monotonic relationship across market environments. The lowest GEX quintile (Q1) consistently exhibits a mean next-day trading range nearly three times larger than that of the highest GEX quintile (Q5). Furthermore, historical sessions where aggregate GEX slipped into negative territory averaged next-day price ranges exceeding 3.5%, compared to significantly subdued ranges during periods of robust positive gamma. Crucially, sub-period analysis across multiple distinct economic eras—including the 2004-2012 financial crisis recovery, the 2013-2019 expansion, and the post-2020 macroeconomic regime—confirms that this predictive anomaly has not been arbitraged away by modern market participants. In fact, rank correlation coefficients have grown increasingly pronounced in recent datasets, proving that gamma exposure captures persistent structural information regarding market liquidity and volatility that standard realized volatility metrics fail to isolate entirely.
Differentiating GEX and GEX500: The Power of Index versus Component Spreads
Advanced quantitative platforms provide multiple gamma exposure series to grant traders a deeper, multidimensional view of market-wide positioning. Specifically, practitioners typically analyze standard GEX—calculated exclusively from S&P 500 index (SPX) options—alongside GEX500, which aggregates gamma exposure derived bottom-up from the individual options chains of all 500 component stocks within the index.
Because index options and single-stock equity options are frequently traded by entirely different market participants for diverse institutional mandates, these two series do not always move in tandem. When both GEX and GEX500 register high positive values, dealer positioning reflects uniform, one-sided stability across the broader equity market. However, when a noticeable divergence or spread emerges between the index-level and component-level metrics, it signals underlying structural tension. Quantitative analysts measure this spread through various quantitative filters, including absolute dollar differences, percentage ratios, rolling percentile ranks, and statistical z-scores. Monitoring the velocity and magnitude of these spreads provides traders with early warning signs regarding whether a prevailing market regime is broadening, strengthening, or actively unwinding.
Deriving Testable Signals and Algorithmic Strategies
Because raw GEX values represent dollar figures that naturally drift higher over extended periods alongside secular growth in derivatives trading volumes, utilizing raw levels directly can distort historical backtests. A reading that appeared exceptionally low or high in 2015 may represent an ordinary baseline today. To ensure consistency across different market cycles, quantitative developers normalize raw GEX data utilizing standardized statistical techniques.
The primary normalization frameworks include rolling percentile rankings (evaluating where current readings sit relative to the prior 252 trading days, mirroring the methodology of the Commitments of Traders index) and z-scores (calculating standard deviations from a rolling historical mean). Additional custom signal families incorporate moving average comparisons, rate-of-change ratios, and new high/low breakouts of positioning momentum. By integrating these normalized metrics into institutional-grade algorithmic development platforms like Build Alpha, traders can convert complex derivatives data into actionable rule-based entries, dynamic position-sizing filters, and robust risk-management protocols.
Strategic Implementation and Risk Management Best Practices
While gamma exposure metrics are calculated directly from S&P 500 derivative products, the resultant structural signals are by no means restricted solely to equity index trading. Dealer gamma serves as a broad proxy for market-wide risk appetite, systemic liquidity, and macroeconomic volatility. Consequently, quantitative strategies leveraging GEX signals have demonstrated efficacy across diverse asset classes, including precious metals like gold futures, fixed-income instruments, and major currency pairs.
Nevertheless, quantitative researchers emphasize that GEX should ideally function as a contextual regime filter rather than a standalone directional trigger. Utilizing gamma exposure to dictate the permissible operating environment—such as permitting breakout strategies exclusively during negative gamma regimes, or deploying mean-reversion tactics solely during positive gamma conditions—significantly enhances strategy reliability. Given the extensive search space provided by numerous customizable parameters and indicators, rigorous out-of-sample validation, noise testing, and parameter permutation remain essential before deploying any quantitative model into live production environments.