Statistical Arbitrage for Independent Traders: A Comprehensive Deep Dive

Statistical arbitrage, a sophisticated trading strategy, fundamentally operates on the principle of mean reversion. At its core, it involves identifying temporary divergences between the prices of related assets and capitalizing on their eventual convergence. While the simplest manifestation of this strategy is pairs trading, where two correlated stocks are identified and traded based on their spread’s deviation from the historical mean, this approach often proves capital-inefficient for individual traders. Triangulated Statistical Arbitrage (Stat Arb) offers a refined methodology, constructing a robust universe of viable trading pairs, then transforming these into per-ticker views for aggregation, ultimately enabling trades on individual mispriced tickers rather than entire pairs. This advanced technique, detailed across a series of articles, culminates in this final piece, which elucidates the practical implementation and the hierarchical importance of its core components.
The overarching framework of Triangulated Stat Arb is built upon three critical pillars: the foundational selection of "good pairs," the sophisticated process of triangulation and consistency analysis to extract actionable signals, and the crucial inclusion of external data features to mitigate risks and avoid common pitfalls. This article aims to showcase the fully resourced application of these three elements, providing an in-depth look at how independent traders can leverage this methodology for potentially enhanced returns. It is important to note that while the conceptual framework is broadly applicable, specific implementation details, such as filter parameters, scoring weights, and cut-off thresholds, are operational choices tailored to individual objectives and constraints.
The hierarchy of impact among these three components is a crucial insight. Not all elements contribute equally to the strategy’s success. Identifying the most impactful segments allows for a more efficient allocation of resources and effort, particularly for solo traders facing limitations in time and capital. The production version of this strategy, as discussed herein, has been undergoing live trading for several months, providing real-world validation of its efficacy.
The Foundation: Identifying High-Quality Trading Pairs
The bedrock of any successful statistical arbitrage strategy lies in the meticulous selection of trading pairs. If the initial universe of pairs is flawed, no subsequent analytical refinement can salvage the strategy. Conversely, a strong foundation of well-chosen pairs significantly amplifies the value derived from downstream processes. Within the Triangulated Stat Arb framework, a pair’s quality is assessed through two key metrics.
The first metric quantifies the potential for frictionless profits derived from trading the mean-reverting behavior of the spread over a defined lookback period. This asks a fundamental question: would a strategy of buying the undervalued asset and selling the overvalued asset generate positive returns in an idealized, cost-free environment? Pairs exhibiting consistent divergence without reliable reversion, often referred to as "drifted" pairs, are systematically excluded. Their reversion-factor score, a measure of their tendency to return to their historical mean, would be low or negative, signaling their unsuitability for this strategy.

The second metric evaluates the consistency of convergence after a divergence has occurred. It distinguishes between spreads that widen throughout a period and only coincidentally snap back at the very end, versus those that reliably exhibit convergence following a significant deviation from their mean. This focus on reliable reversion, rather than mere statistical cointegration, is a departure from traditional methods and directly addresses the practical profitability of the trading strategy. As noted in related research, "Notice how we measured the thing we care about directly. Not a cointegration test as far as the eye can see!"
By combining these two metrics, a robust filter is established, identifying pairs of assets that exhibit a reliable tendency to deviate from their historical relationship and subsequently revert, creating exploitable trading opportunities. Further insights into this pair selection methodology can be found in the article "Moneyball — Finding Undervalued Pairs Using Unconventional Metrics."
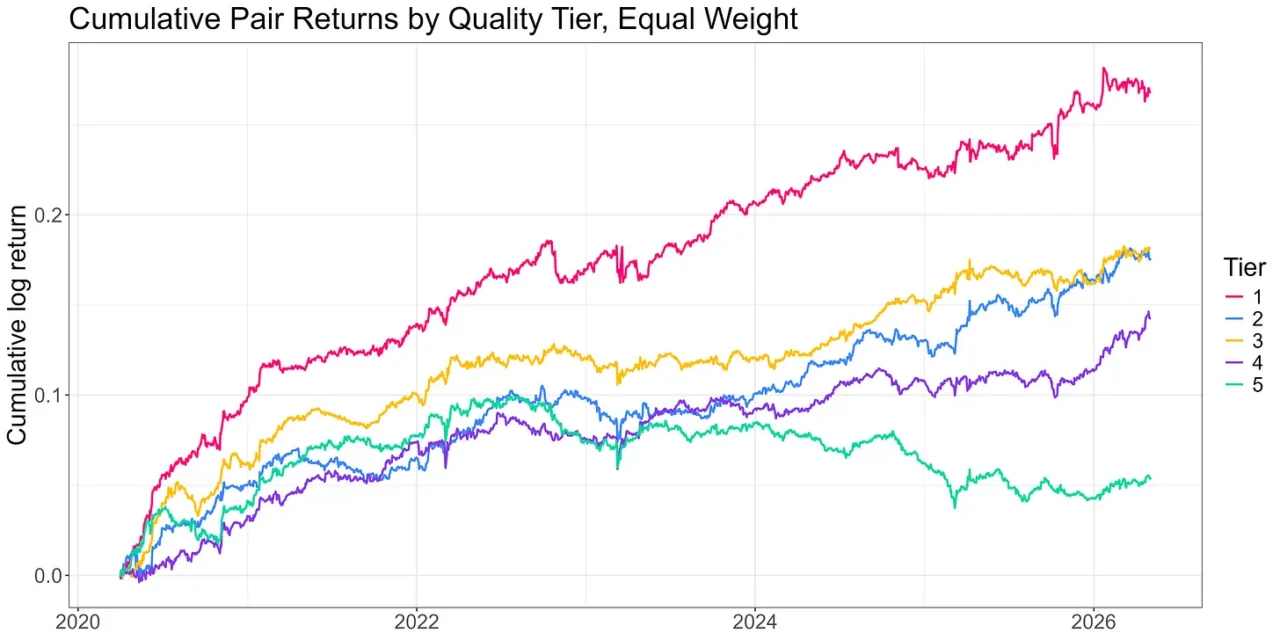
Typically, the top 10% of pairs, as ranked by this system, are selected for further analysis, provided they also demonstrate economic rationale, such as being exposed to similar risk factors. This selection process is conducted monthly, utilizing the preceding 24 months of historical data. Within this elite group, pairs are further categorized into five tiers. The performance of a simple, equal-weighted pairs trading strategy applied to each tier, before accounting for transaction costs, illustrates the effectiveness of the ranking system.
Data analysis reveals a clear performance gradient: Tier 1 pairs consistently outperform, demonstrating significantly higher before-cost returns. While the middle tiers exhibit more variability, they generally perform well, and Tier 5 pairs are demonstrably inferior. Quantifying risk-adjusted returns across these tiers showcases a substantial difference. A spread of approximately four times in Sharpe Ratio is observed between the top and bottom tiers. Although total returns for pairs trading can be relatively low, a common drawback that Triangulated Stat Arb aims to address, the ranking system’s ability to isolate profitable opportunities is undeniable. This foundational work in pair selection is paramount, dwarfing any potential gains from subsequent signal-generation refinements.
The construction and maintenance of the pair universe involve numerous subtle considerations, including liquidity filters, industry constraints, data refresh cadence, and the handling of corporate actions like delistings and acquisitions. Careful attention to these details is essential. However, the most significant returns are generated by the painstaking, upstream process of creating a clean, ranked universe of high-quality pairs. While this requires more diligence and analytical rigor than automated cointegration testing, its practical efficacy is far superior. Crucially, the majority of the alpha captured throughout the rest of the pipeline is predetermined once this initial universe is established.
Triangulation and Consistency: Extracting Alpha from Ticker-Level Signals
Once a robust universe of high-quality pairs has been identified, the strategy shifts from analyzing pairs to analyzing individual tickers. This transition, known as triangulation, addresses two primary limitations of traditional pairs trading: capital inefficiency and signal wastage, as detailed in "The Winter of our Pairs Trading Discontent." By transforming pair-level insights into ticker-level signals, the strategy becomes more adaptable and capital-efficient for individual traders.
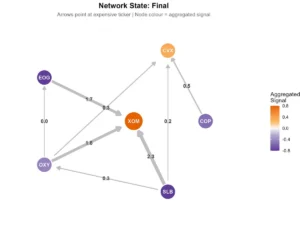
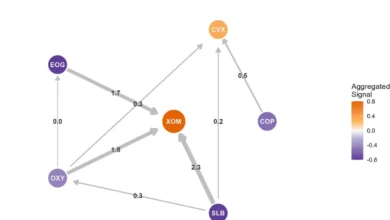
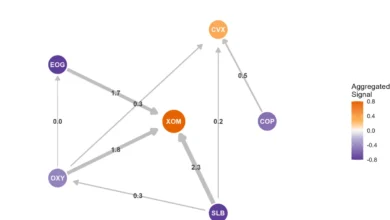
For every ticker within the selected universe, the methodology examines all the pairs it participates in. Each pair provides a per-ticker view, indicating whether the ticker is undervalued (long position) or overvalued (short position) relative to its counterpart, along with a z-score that quantifies the extent of this deviation from the mean. These per-ticker views are then aggregated across all pairs a given ticker is involved in. The resulting aggregated view forms the basis for the tradeable signal. This network effect, where multiple pairs converging on a single ticker’s mispricing provide stronger evidence than any single pair, is a core innovation. More details on this approach are available in "The Metamorphosis."
While the network signal offers a meaningful improvement, its effectiveness hinges on proper implementation. Naive aggregation can lead to suboptimal results. Two common pitfalls include:
- Ignoring Correlation: Simply averaging signals from correlated pairs can lead to an overemphasis on a few dominant relationships, masking true diversification benefits.
- Lack of Consistency Weighting: Assigning equal weight to signals from pairs with varying degrees of historical consistency can dilute the impact of more reliable signals.
A critical operational decision involves determining how to translate the ticker-level signal into actionable trades. The signal is most potent at the extremes of its distribution; the central range typically represents noise. By focusing trades on these extremes, rather than every identified mispricing, the overall performance is materially enhanced. This mirrors the practice in pairs trading, where trades are not initiated at a z-score of 0.5, but rather at more significant deviations.
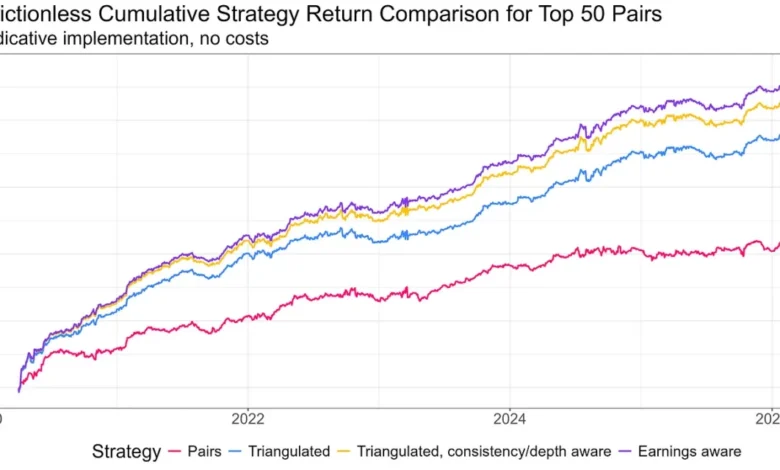
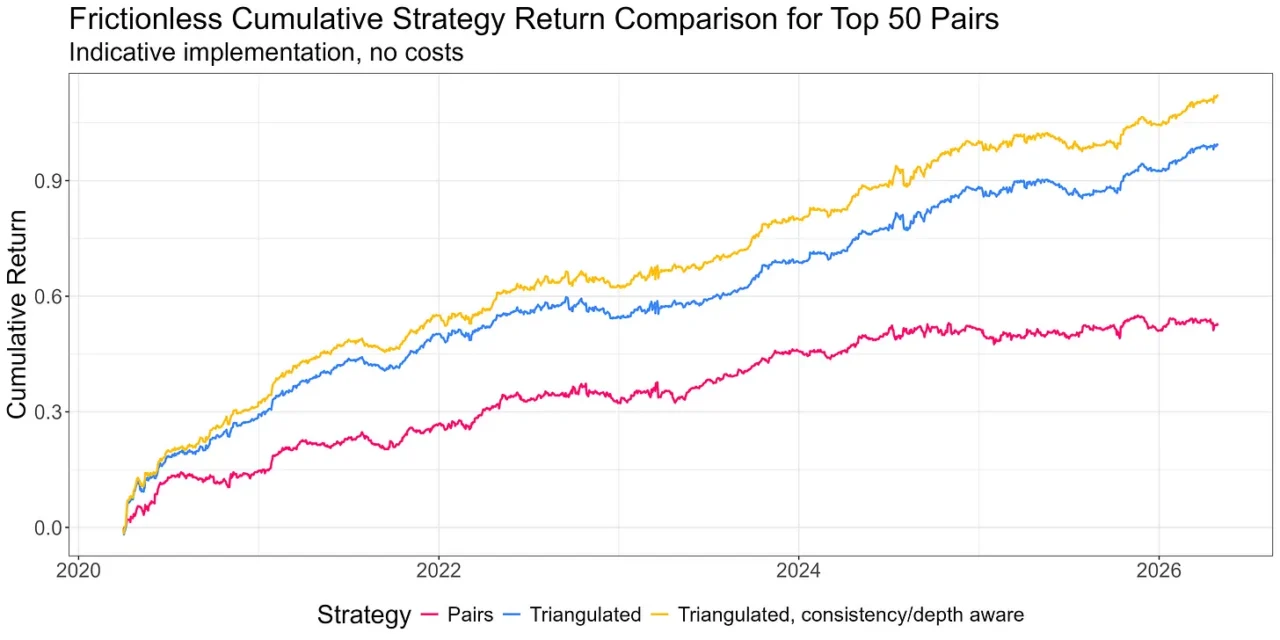
A comparative analysis of returns demonstrates the impact of these refinements. Trading a portfolio of the top 50 pairs yields a certain level of return. However, transforming these into a triangulated long-short portfolio of mispriced legs significantly outperforms. Further enhancement is achieved by incorporating depth and consistency metrics, leading to a more refined and potentially more profitable strategy. This approach is demonstrably more capital-efficient for individual traders, optimizing resource allocation.
Mitigating Risk: Avoiding Unwanted Exposures
The Triangulated Stat Arb signal reliably indicates that a spread has deviated from its mean. However, it does not inherently explain the reason for this divergence. A spread signaling "short the expensive leg" could be driven by a temporary technical factor, such as forced selling that is likely to reverse, or by new, fundamental information that has legitimately repriced the stock. The former presents a profitable fading opportunity, while the latter suggests a continuation of the price movement, making a fade detrimental. Distinguishing between these scenarios constitutes the third crucial piece of the statistical arbitrage puzzle.
The primary avenues for investigating these divergences lie in analyzing volume, news, and event data. Each of these data types can offer clues as to whether a price divergence is purely technical and therefore fadeable, or fundamentally driven and best avoided.
Initial research explored volume asymmetry, with the hypothesis that forced selling on a cheap leg would present different characteristics than informed buying on an expensive leg. While a real effect was observed at the pair level, its impact diminished significantly when integrated into the production strategy. The prevailing theory is that much of the information conveyed by volume was already captured by the upstream pair-quality assessment. A deeper analysis revealed that the aggregation process from pairs to tickers effectively diluted the volume signal, rendering it less impactful in the current framework. Consequently, volume features are not currently incorporated into the live strategy. Had the strategy remained focused on individual pairs, the inclusion of volume features would likely have been more beneficial.
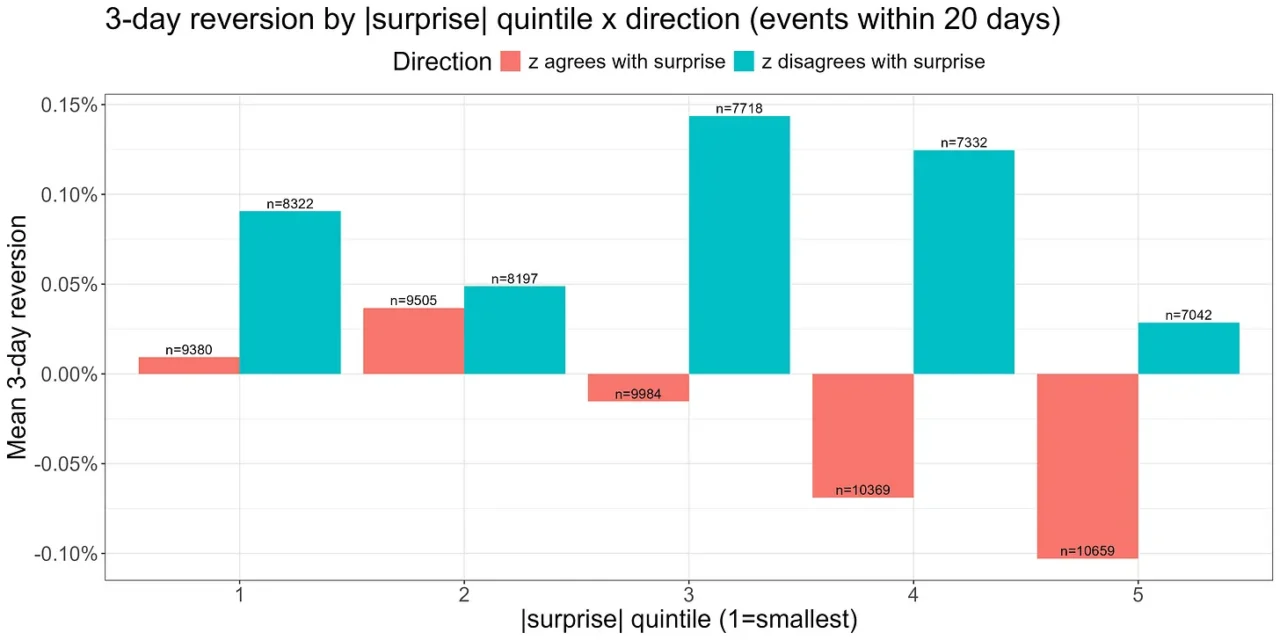
The most significant gains in this third stage have emerged from an earnings filter. When an earnings surprise occurs during a spread’s formation period, the spread may appear stretched in the direction of the surprise. However, stocks that move on genuine earnings news have fundamentally repriced, and fading such moves is generally ill-advised. This mechanism is logically sound and empirically supported by data. Its inclusion provides a small but meaningful uplift to the live strategy.
Empirical evidence supports this. Analyzing three-day reversion rates (three-day forward returns, signed by the negative of the z-score) during periods of earnings surprise within the spread’s formation period reveals a critical pattern. When the z-score is stretched in a direction implied by the earnings surprise (indicated by red bars in the analysis), reversion is significantly reduced. For substantial surprises, the reversion can even become negative on average, indicating a continuation of the price movement – a manifestation of the post-earnings drift effect.
The addition of an earnings filter to the trading strategy has demonstrated a clear positive impact on performance. Broader news event analysis represents the next frontier for this component. The intuition that a surprising event, driven by genuinely new information, can invalidate the mean-reversion thesis is expected to generalize. Any significant event that reprices one leg of a spread based on new information is likely detrimental to the mean-reversion hypothesis.
While the third piece of the methodology is undeniably important, its incremental gains are less pronounced than one might initially expect. This is a testament to the robustness of the upstream pair-quality work, which accounts for an estimated 80-90% of the strategy’s efficacy. This pattern of diminishing marginal returns is consistently observed as each successive component is refined.
Resourcing the Strategy: Infrastructure and Community
The conceptual framework of Triangulated Stat Arb is brought to life through robust resourcing. In the RW Pro platform, an Application Programming Interface (API) delivers end-of-day and intraday spread data, supporting live trading operations and historical research. The upstream pipeline responsible for generating the monthly pair universe from thousands of candidate stocks is a substantial undertaking, involving extensive data ingestion, cleaning, and computational ranking across hundreds of thousands of potential pairs. The cost of this data and compute infrastructure alone would exceed a year’s subscription to RW Pro, not to mention the labor involved in building and maintaining it. This foundational work has been completed and is leveraged for the benefit of the community.
The data is available not only for trading but also for in-depth exploration. Members have access to a research environment containing the full historical datasets used in the methodology’s development. This allows them to test their own hypotheses regarding pair selection, explore additional features for the third component, or develop alternative signal construction methods.
A particularly valued aspect of the offering is an example implementation notebook within the research environment. Recognizing that no single "one-size-fits-all" solution exists for statistical arbitrage, this notebook allows members to experiment with various configuration knobs. These include universe size, weighting schemes, no-trade buffers, signal thresholds, and leverage. This hands-on approach fosters a deeper understanding of the strategy’s nuances and encourages members to tailor the implementation to their specific circumstances, such as account size, cost structures, risk tolerance, and operational capacity.
This customization is critical. A full-time trader managing a $5 million portfolio will have different constraints than a part-time trader managing $100,000. The platform cultivates a community of traders operating at various scales, all possessing a clear understanding of what they are trading, why they are trading it, and the associated trade-offs. This focus on developing independent traders, equipping them with the knowledge and tools to succeed regardless of market conditions, is a core objective.
The development of this methodology was a collaborative effort. Over a six-month period, the research unfolded within the membership, with community members actively participating, posing questions that drove the research forward, and contributing their own findings. Some of these community contributions are now integrated into the live strategy, highlighting the reciprocal nature of the knowledge exchange and the collective benefit derived.
In conclusion, the Triangulated Stat Arb methodology, when properly resourced, presents a powerful approach for independent traders. The hierarchy of returns emphasizes the foundational importance of pair selection, with subsequent refinements offering diminishing but still significant uplifts. The transformation of pairs trading into a ticker-centric strategy, coupled with risk mitigation techniques, makes equity pairs a viable and potentially profitable avenue for solo operators. The underlying infrastructure, encompassing data APIs, research environments, and a collaborative community, democratizes access to this sophisticated strategy, empowering traders to navigate its complexities and develop their own independent trading prowess. For those who have followed this series, the conceptual roadmap is now complete. For those interested in witnessing the resourced version in action, the opportunity to explore further is readily available.